LoadRunner Tool

Selecting the Protocol in Script Editor:
Method 1: Using web_custom_request function and a .json file.
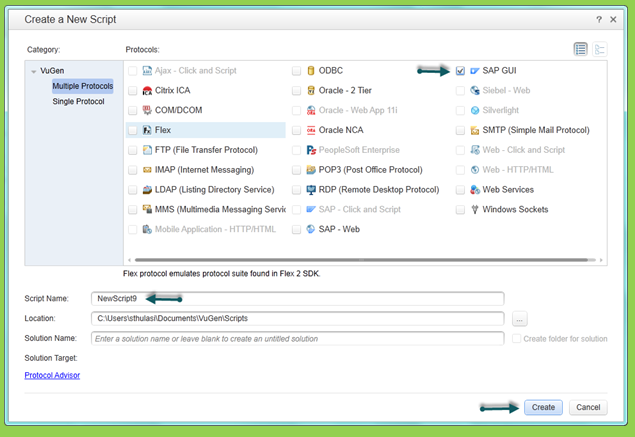
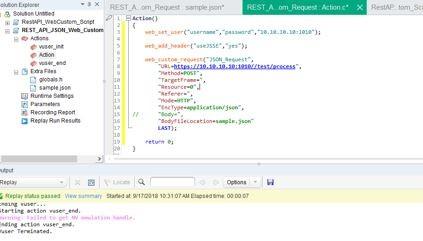
Create a Web - HTTP/HTML script and insert web_custom_request function.
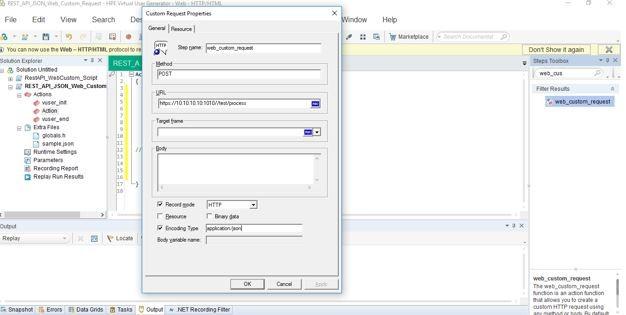
Enter the Step Name, Method(POST), URL of your REST API, Record Mode(HTTP), Encoding Type(application/json).
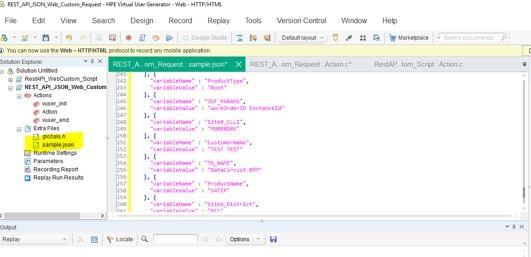
Create a ‘sample.json’ file under Extra Files.
Place the JSON message in the sample.json file you created in previous step.
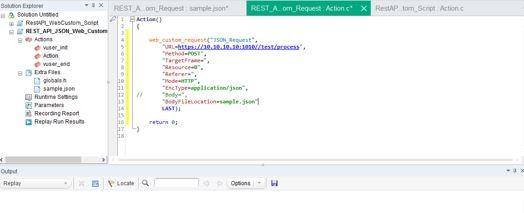
In web_custom_request part, remove the line “Body” and add a new line BodyFileLocation. And the line should look like this after the change "BodyFileLocation=sample.json".
Some Sites requires user authentication to access the content. In that case you may have to use user credentials along with your request. Use web_set_user to pass the user credentials.
If you need to pass any headers into the script, you can do so by using web_add_header function.
After following above steps, you should be able to run your script successfully.
This method can be used when you have a very big JSON request. Drawback of this method is, you cannot parameterize any values inside JSON request. This would not help us when we need to run the test with multiple data. To overcome this you can make use of below method to create a script.
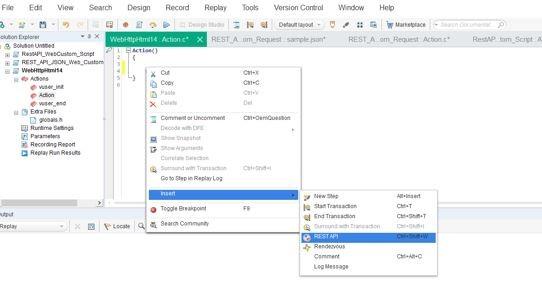
Method 2: Using web_rest function and placing JSON request within the body of the script.
Create a new Web- HTTP/HTML script and insert the REST API function.
Enter the REST API url, Encoding Type (application/json). Enter the JSON request in the body and insert the step.
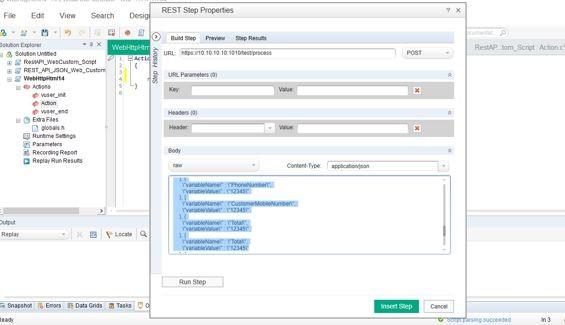
Pass User credentials and Headers as needed.
Script would look like this after all the modifications.
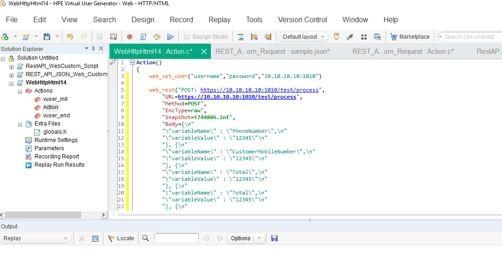
You can parameterize any values as you would do in any other script.
Parameterization In LoadRunner
Now let’s see how we parameterize the data values.
Example: If we want to parameterize the username value in our script, select the value, right-click and select ‘Replace with Parameter’ -> ‘Create new parameter’.
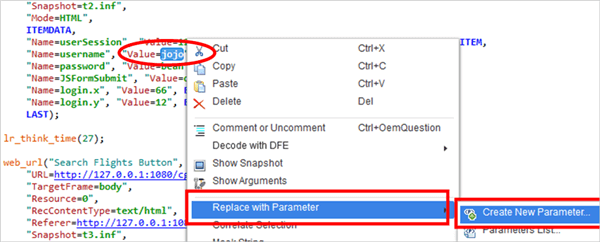
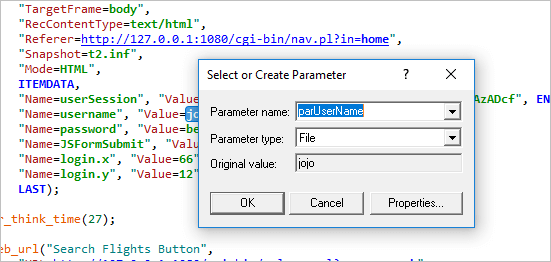
Enter the parameter name. We can enter any name here (we have added the prefix ‘par’ just for our convenience – which means this is a parameterized data).
Next, VuGen will prompt for this.
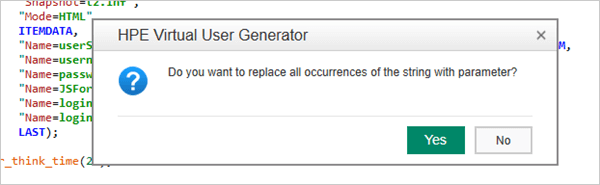
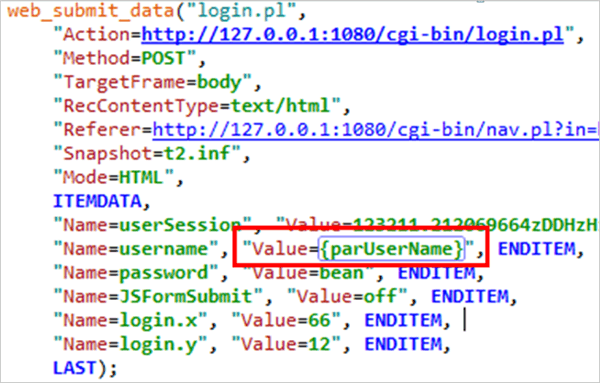
Click ‘Yes’. VuGen will replace all occurrences of the username value with the parameter as shown (remember parameters are always enclosed in curly braces).
Now, in order to view the parameter(s) that we created, click on ‘Parameters’ item on the ‘Solution Explorer’.
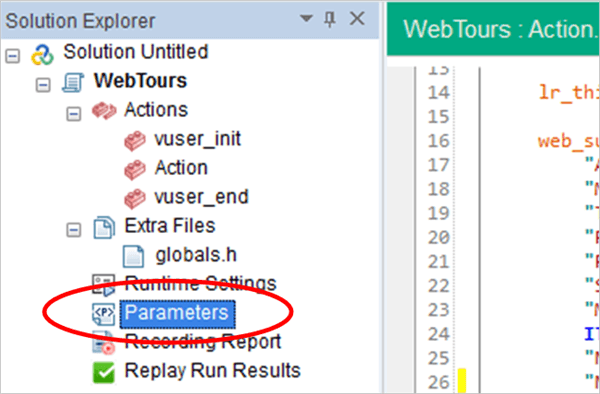
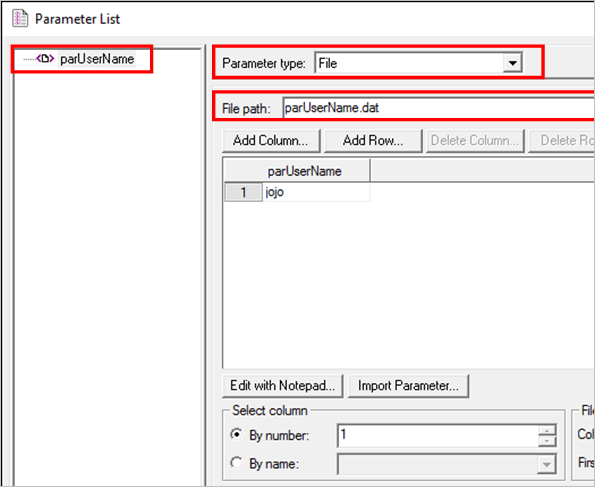
This will open the parameters list window. This list will show the username parameter that we created.
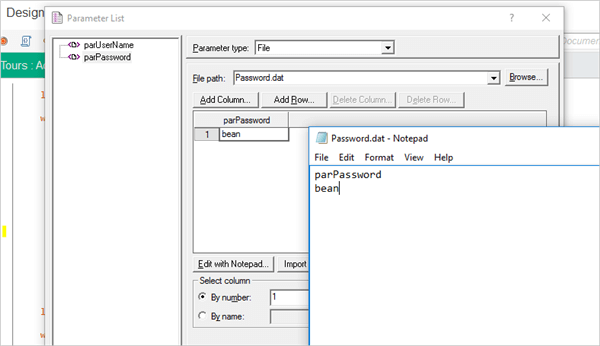
The parameter name is ‘parUserName’ (the parameter name that we entered), the parameter type is ‘File’ (this is the default parameter type – we will discuss the other types of parameters later in this tutorial) and the parameter file name is ‘parUserName.dat’ (parameters are generally stored in a text file that is saved in the script folder, by default the name of this text file is the parameter name itself).
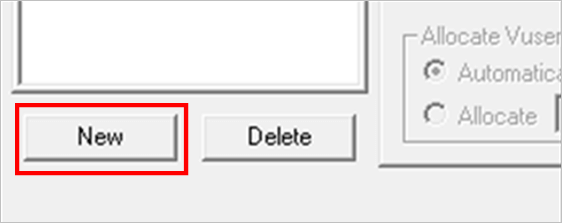
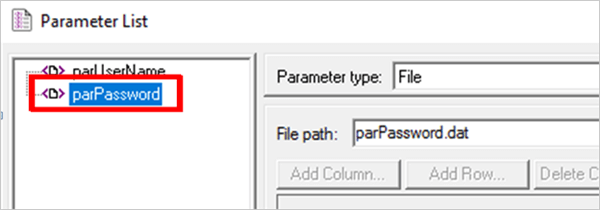
We can also create the parameters from the ‘Parameter List’ window directly. Just click on the ‘New’ button on the bottom left.
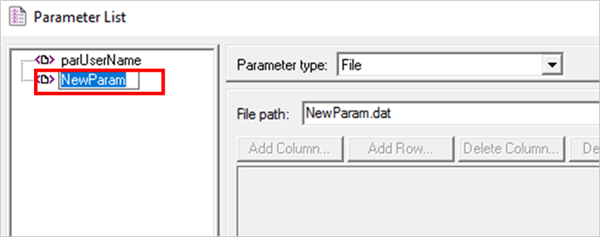
The new parameter is added to the list.
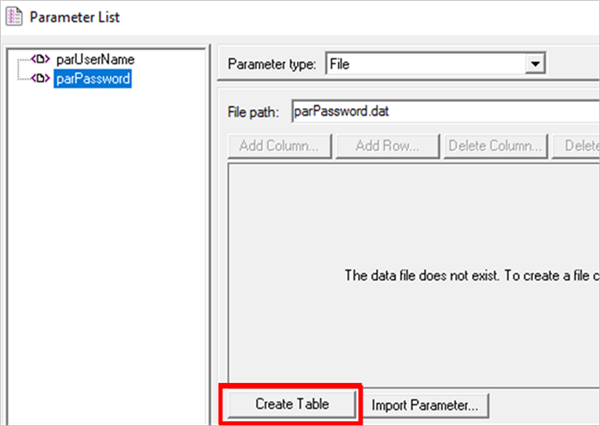
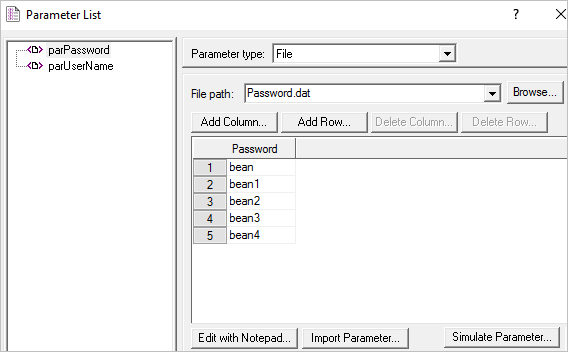
Rename the parameter name to say ‘parPassword’, select the parameter type (default is File), choose the file name and path.
Now click on ‘Create Table’.
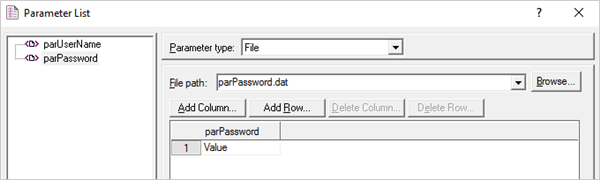
We can now see and edit the values for this parameter (note that this file has one column and the default name of the column is the parameter name itself).
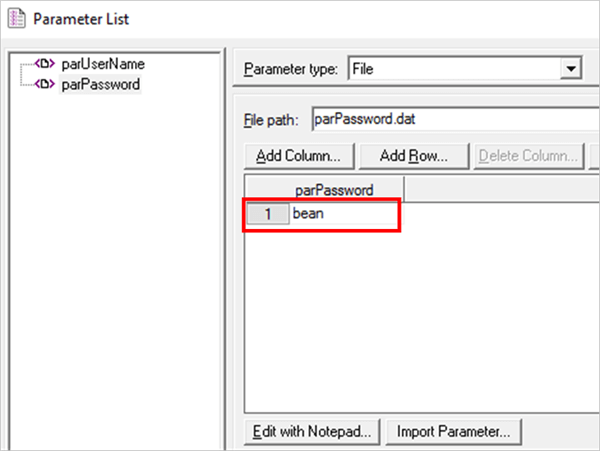
Example: Here we have changed the value to ‘bean’.
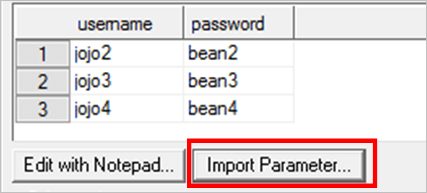
We can also change the values in another way – click ‘Edit with Notepad’ button and edit the data in the text file directly.
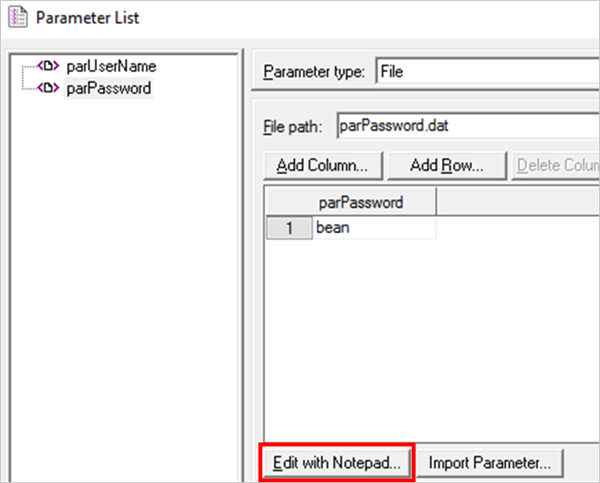
In fact, this is the easiest way of editing the data, particularly when we are dealing with huge data, we can just copy and paste the required data, easily edit on the notepad and so on.
Now, let us add few more values for the ‘parPassword’ parameter.
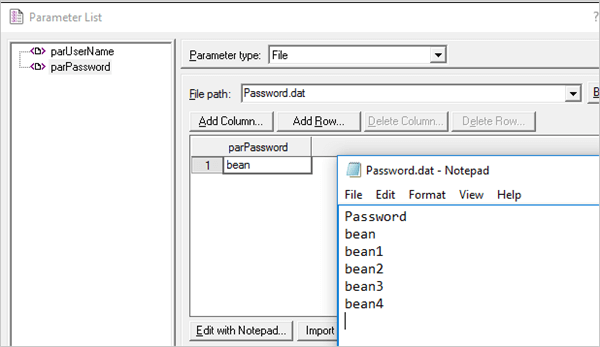
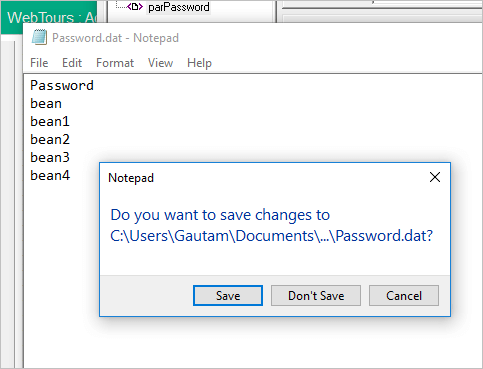
Close the notepad and click on ‘Save’ (to save the changes made to the text file).
So the added values are reflected in the ‘Parameters List’ window (for the ‘parPassword’ parameter).
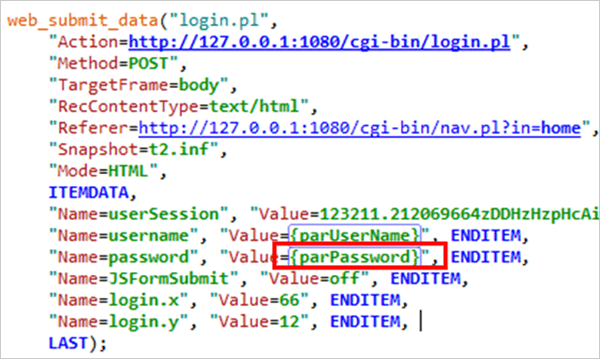
Remember that when we directly create parameters on the ‘Parameter List’ window, we have to manually replace all occurrences of the value in the script with parameter name (of course in curly braces).
So go to the search menu (Search->Quick Replace).
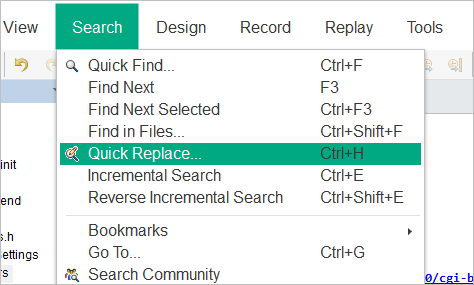
And make the replacement.
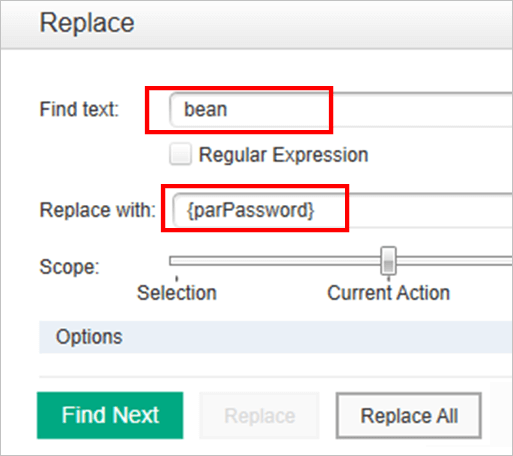
In the script.
One more thing to note is VuGen by default creates a new text file for each of the parameters created.
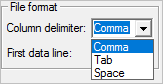
But we can also save more than one parameter value in a single text file by putting them under different columns separated by a delimiter (‘comma’ is the default limiter). This is done particularly for data values that are dependent (Example: username and password).
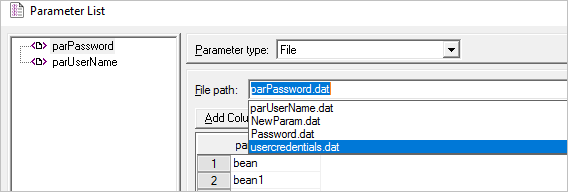
Let’s see how we can do that. We will put the username and password values in a single file. In the ‘parUserName’ parameter that is already created, change the file name to say ‘usercredentials.dat’ (this will create a new file with this name under the script folder).
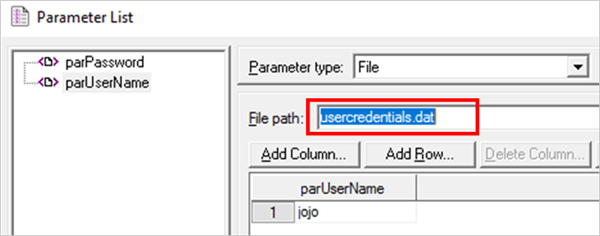
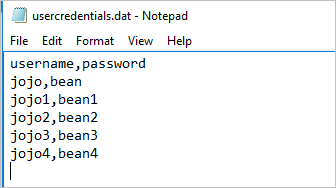
Now open this file with a notepad, add two columns – username and password separated by a delimiter (comma here) and also add some values for username and password separated by the comma delimiter as shown below.
Now close and save the file.
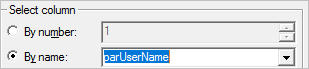
Next, we have to link each parameter with the column names. This can be done from the ‘Select column’ section where we can link by the column name or column number.
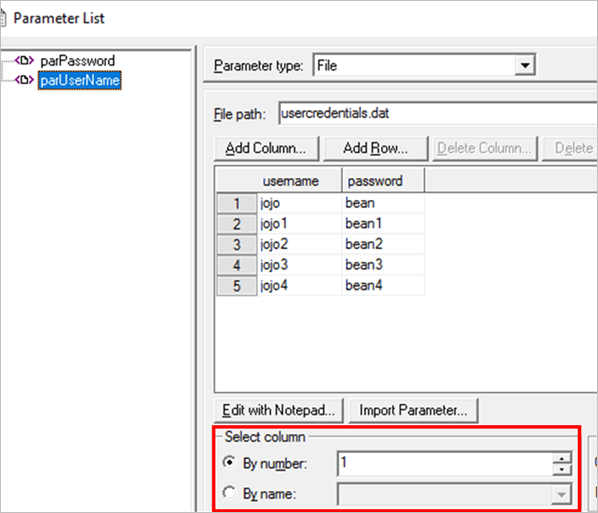
Here we have linked the ‘parUserName ‘parameter to the first column of the text file ‘By number’.
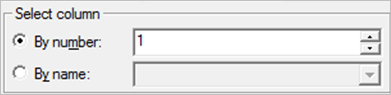
We can also do the same with ‘By name’.
Now let us go to the ‘parPassword’ parameter, change the file name (to the ‘usercredentials’ file that we created).
And now we have to link the ‘parParameter ‘parameter to the second column of the text file (as the password values are in the second column) ‘By number’ or ‘By name’.
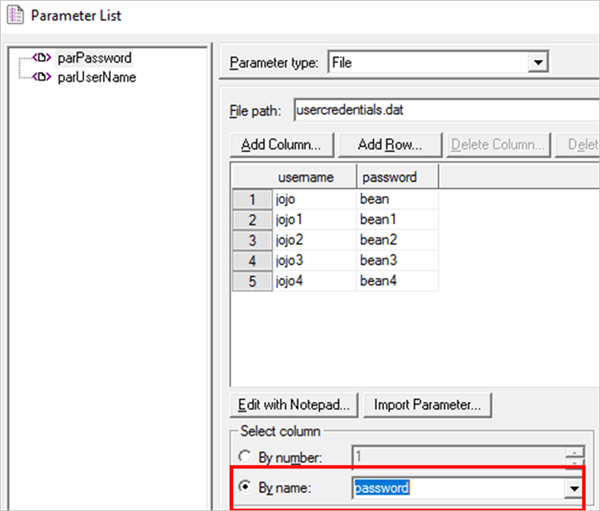
It is a good practice to use the column names as it will avoid confusion, particularly when we have a larger number of columns.
So far we have understood how to create multiple parameters and link them to the values in a single text file.
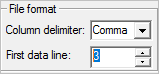
Coming to the other parts of the ‘Parameter List’ window, under the ‘File format’ section, we have two options:
Column delimiter: This allows us to select a delimiter when we use multiple columns in the text file. The comma is the default delimiter (as we saw above) but we can also choose the Tab or Space. This option is very useful in cases where the data itself has commas (Example: an address) and using comma delimiter can screw things.
First data line: This is used to specify which row to start with (default is 1). We can change it to any value (till the maximum number of values in the text sheet). Ex: If we change it to 3, VuGen will start picking from the third-row value (ignoring the first 2 data values).
This is useful when for some reason we don’t want VuGen to pick some data values and at the same time don’t want to completely delete them from the file.
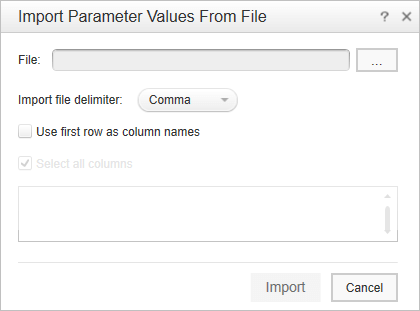
The ‘Import Parameter’ option allows us to import data from an external file directly.
Click on ‘Import Parameter’ button.
Here we can select the file, specify the delimiter and configure the other options.
Now coming to two more important options:
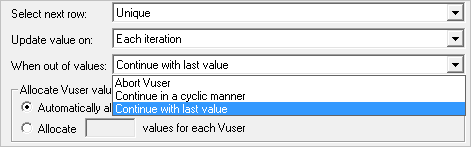
Select next row: Instructs VuGen how to select the data values during the test when multiple Vusers are running (and each Vusers is running for multiple iterations). We mainly have three options here –Sequential, Random, and Unique.
Update value on: Instructs VuGen when to update the data values of the parameters. We have three options here –Each iteration, Each occurrence and Once.
The combination of these two options defines what values (from the data file) are to be taken by each Vuser for each iteration and each occurrence (within an iteration).
Let us understand each of these combinations in detail now:
a) Sequential-Each iteration: Every Vuser starts from the first data value in the text file and goes to the next row value in every new iteration sequentially. If there are not enough values in the file, Vuser returns to the first value in the file (continuing in a loop till the end of the test).
b) Sequential-Each occurrence: Every Vuser starts from the first data value in the text file and goes to the next row value in every new occurrence (within the iteration) sequentially. If there are not enough values in the file, Vuser returns to the first value in the file (continuing in a loop till the end of the test).
c) Sequential-Once: Every Vuser on every iteration and every occurrence (within an iteration) takes only the first value from the data file.
Example: Say we have five urls and for a particular test we want to use only one (of these five), in such a case we can set this option.
d) Random-Each iteration: Every Vuser takes a new random data value from the text file on every iteration. Here duplication of values is possible as the selection of values is random.
Example: If we have an application which generates sales report for a given month (Jan, Feb …… Dec), we can set this option so that Vusers pick one of these twelve months randomly and generates a report.
e) Random-Each occurrence: Every Vuser takes a new random data value from the text file on every occurrence (within an iteration). Here duplication of values is possible as the selection of values is random.
We can set this option for similar scenario (sales report) as explained above; the only difference is here Vusers will pick a random month on every occurrence.
f) Random-Once: Every Vuser takes a random data value from the text file on the first iteration and sticks to the same value for all iterations and occurrences.
Example: we have an application/scenario where a user has to randomly pick up a product (from a list) and work on the same product for all iterations and occurrences, we can set this option.
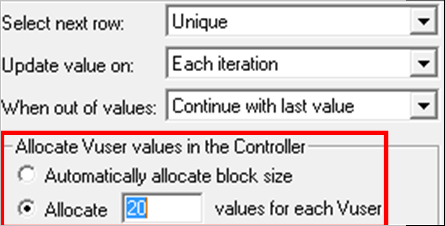
g) Unique-Each iteration: Every Vuser for every iteration takes the first unused (unique) data value from the text file.
We have some additional options available for this combination:
When out of values: Instructs a Vuser on how to handle the script when the values are exhausted.
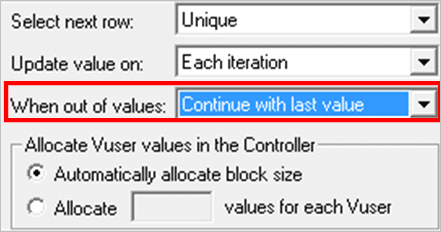
We can select any of these from the dropdown list.
Allocate Vuser values in the Controller: This option is used to instruct VuGen to allocate a block of values (a group of values) for every Vuser. In this way, values will be unique to Vuser. The size of the block (number of values) can be specified by us or left to VuGen to calculate. For Example, if we have 100 values and 5 Vusers, we can allocate ‘20’ values per Vuser (as shown below).
Example: If we have an application/scenario where we have to use say discount coupon ids and these ids are unique to a user, under such cases we can use this option.
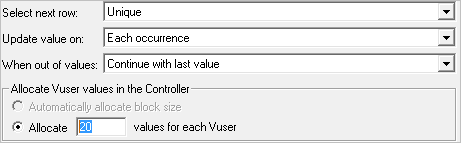
h) Unique-Each occurrence: Every Vuser for every occurrence takes the first unused (unique) data value from the text file.
Like with ‘Unique-Each iteration’, here also we will have the same additional options (only difference here is we have to mandatorily allocate block size here).
Example: If we have an application/scenario where we have to use say discount coupon ids and these ids can be used only once, we can use this option.
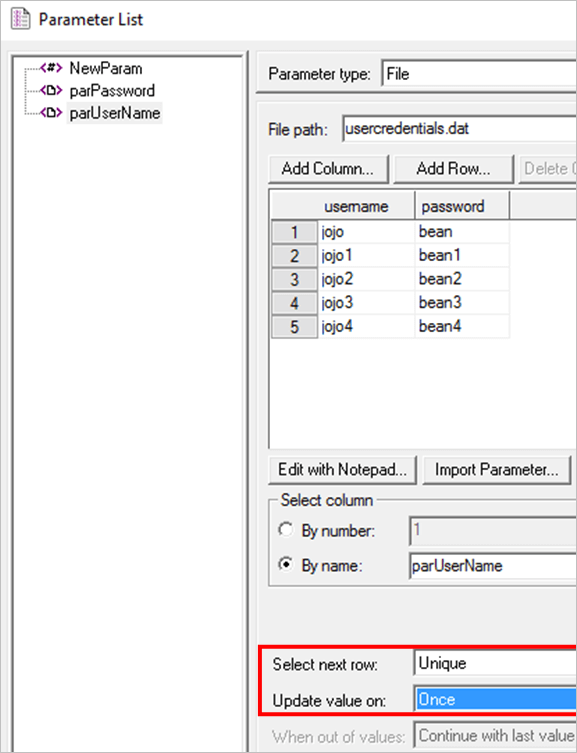
(i) Unique-Once: Every Vuser takes an unused (unique) data value from the text file on the first iteration and sticks to the same value for all iterations and occurrences.
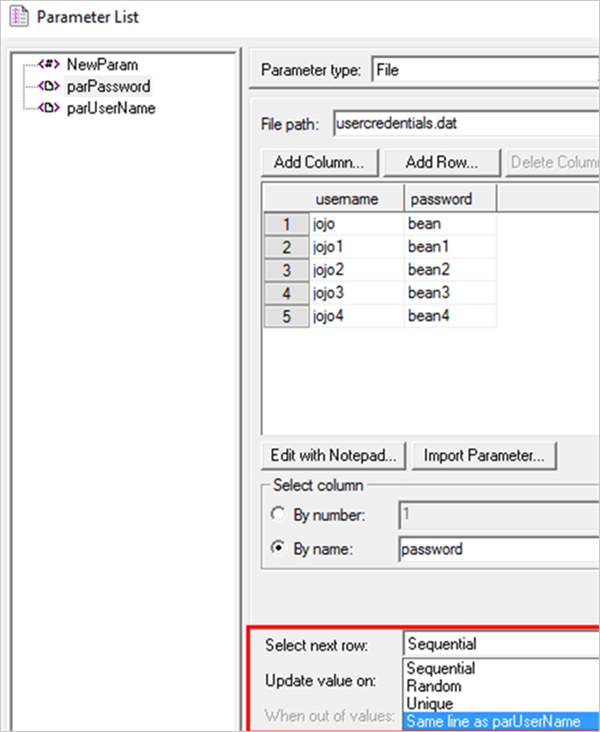
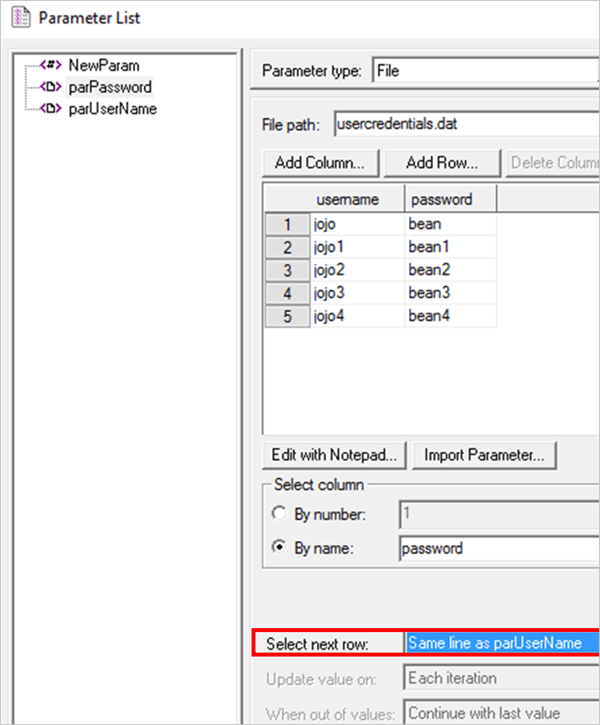
Example: We can use this option for login details (username and password) because these have to be unique to every user.
One more thing – When we have parameters that are related, then we can set one of the above combinations for one parameter and direct VuGen to use the same for the other parameter(s).
Example: Here we set the ‘Unique-Once’ combination for the username parameter.
Now for the password parameter, instead of setting again, we can just select ‘Same line as parUserName’. This will instruct VuGen to just follow what was set for the username parameter.
Other types of parameters:
We discussed the default type – ‘File’ type of parameter already. There are other types of parameters as well and we can see them in the ‘Parameter type’ dropdown list.
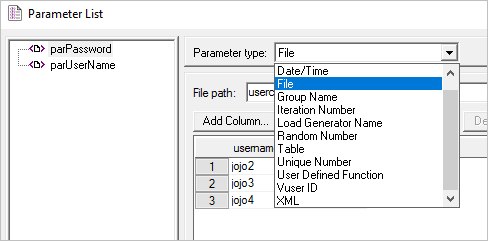
Let’s discuss some of these now:
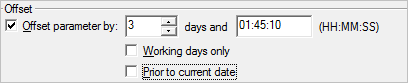
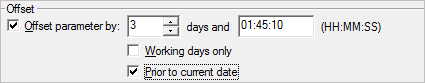
a) Date/Time: This type of parameter allows a Vuser to pick the current date and time in a specified format.
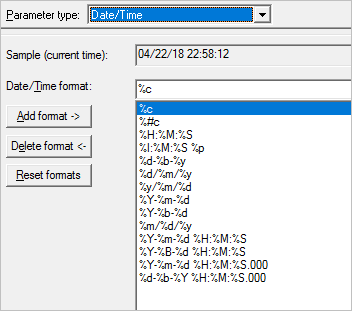
It also allows selecting a future date using the ‘Offset’ option.
It also allows selecting a past date using the ‘Prior to current date’ offset option.
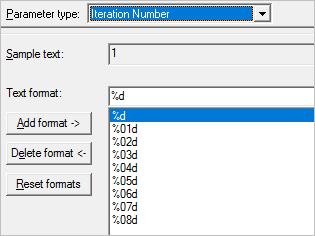
b) Iteration Number: This type of parameter allows a Vuser to pick the iteration number in a specified format.
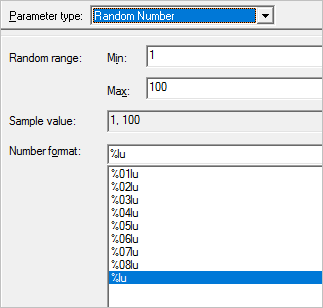
c) Random Number: This type of parameter allows a Vuser to pick a random number from a given range in a specified format.
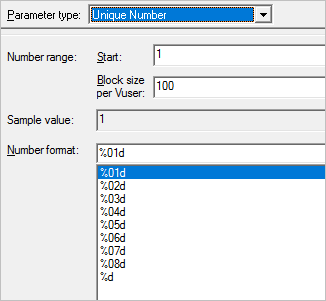
d) Unique Number: This type of parameter allows a Vuser to pick a unique number by specifying a number range and block size per user.
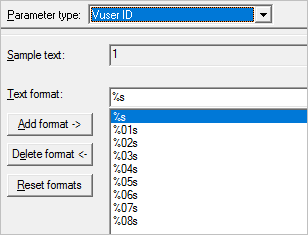
e) Vuser ID: This type of parameter allows picking a Vuser id in a specified format.
How to Launch Controller
To launch HP Controller, go to Start Menu ->HP Software ->HP LoadRunner ->Controller as demonstrated below:
After you’ve launched, you’ll see a splash screen appearing momentarily. A quick snap has been displayed below:
The snapshot will automatically lead to the main window of HP Controller. Let’s have a look at it before we discuss main components of the screen.
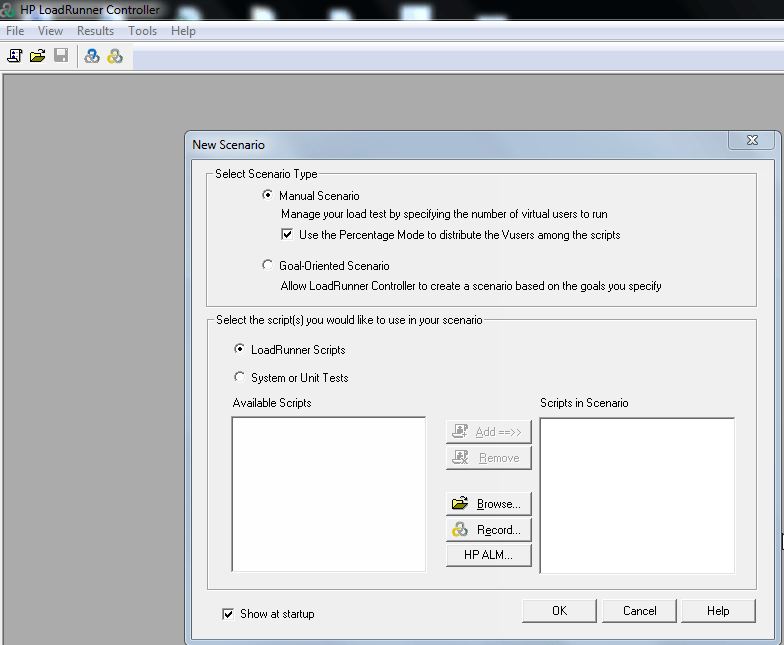
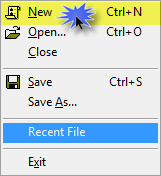
If the “New Scenario” screen doesn’t come up automatically, (after you’ve changed the preference) you can click on New button under File Menu or click on button from the toolbar. Alternatively, you can click Ctrl + N. The menu has been displayed below for reference.
Similarly, to open an existing or previously created scenario you can use Ctrl + O or icon, and it will open a standard dialogue box to browse files. The extension of a Load Runner Scenario file is *.lrs
There are two types of scenarios in Controller.
Manual Scenario
Goal-Oriented Scenario
Manual Scenario can further or may not have Percentage Mode. We will discuss each in detail.
Simulating a Manual Scenario
A manual scenario is static and gives more control over the situation. You can decide which transaction to execute, for how many of times, for how long.
Based on the composition of test mix, you can see application behaviour such as number of hits, response time, etc.
You will find out how a manual scenario is different from Goal Oriented scenario later.
In order to create a Manual Scenario, select Manual Scenario from “Select Scenario Type”
For now, let’s use non-percentage mode, to begin with. Have a look at the snapshot illustrated below:
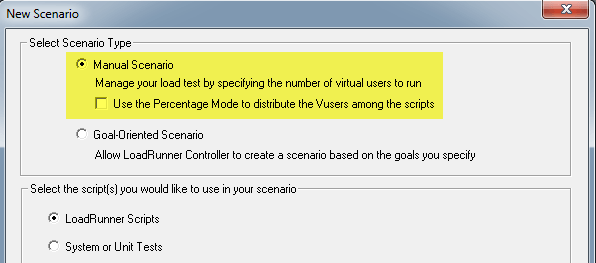
You can select the scripts you wish to add to the scenario right from the above screen. However, it is generally practiced to add the scripts later.
Click the OK button to proceed.
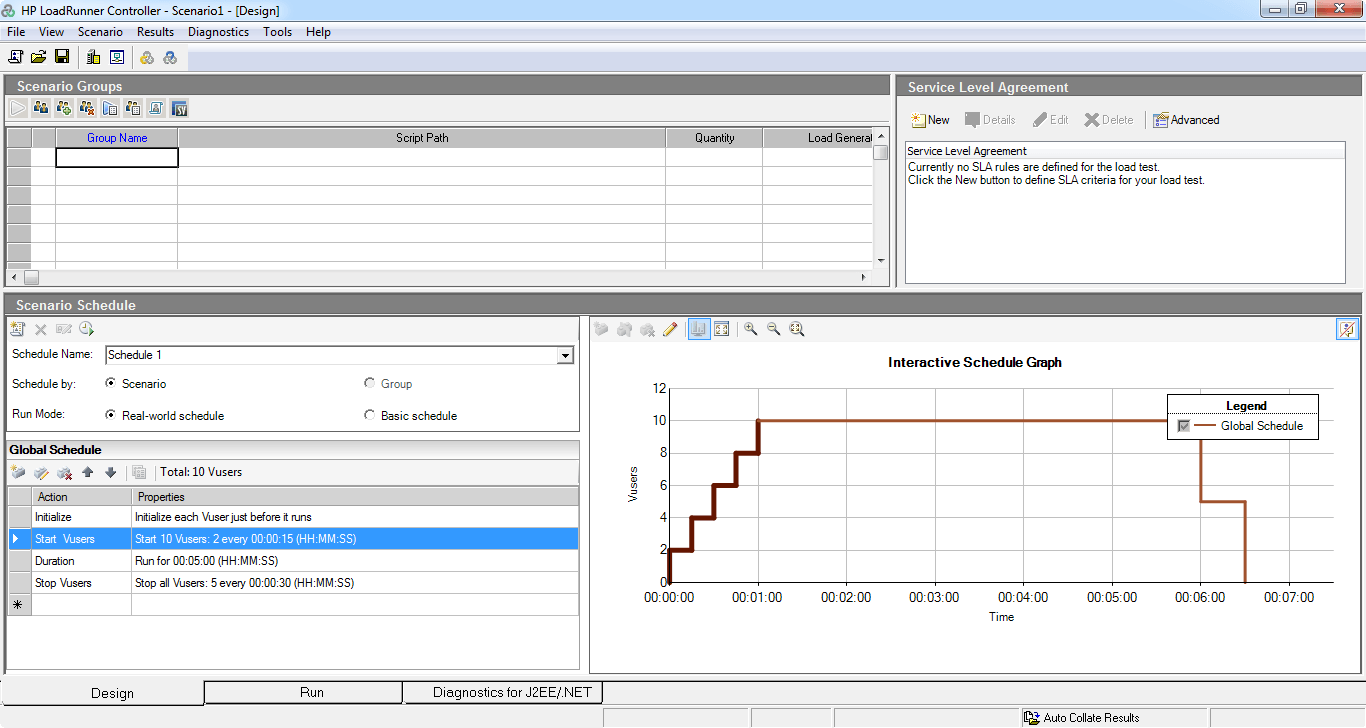
This will create a blank scenario and load it into the main screen. You will notice the Save button is enabled now. Have a look at the snapshot below:
Likewise, if you selected Percentage Mode while selecting type of scenario, the screen will appear slightly differently. Instead of number of users, it will show the distribution of users in percentage. Controller distributes users per assigned percentage automatically.
The rest is same. Refer to snapshot below:
If you do not create a Scenario at the start, you will notice the toolbar as below:
You can click on button to create a new blank Scenario. Once a scenario has been created, you can click on button to Save a scenario or click Ctrl + S. Likewise, you can click on button to open an already existing scenario from your local computer drive.
The remaining button simply invokes other components of LoadRunner. The button invokes VUGen and button invokes HP analysis.
Once you add a VUSer script or group, you will notice the subject toolbar will show additional icons. The new toolbar will look like this:
The new toolbar has 2 additional controls.
The button opens the list of all Load Generators. In our case, we’re using “localhost” as a generator. This means that your local machine will be used by Controller as well as Generator to simulate virtual user load. The Network Virtualization Settings can be opened by clicking on icon. Network Virtualization requires Shunra NV for HP Software version 8.6 or higher installed in your machine. This integration enhances test accuracy by virtualizing production network conditions in the load and performance test environment. To incorporate Shunra NV for HP Software into your test environment, contact your HP service representative.
Now that you’ve created a new, blank LoadRunner Scenario, please make a note of
Default configurations of a new scenario:
Scheduled by: Scenario
Run Mode: Real World schedule
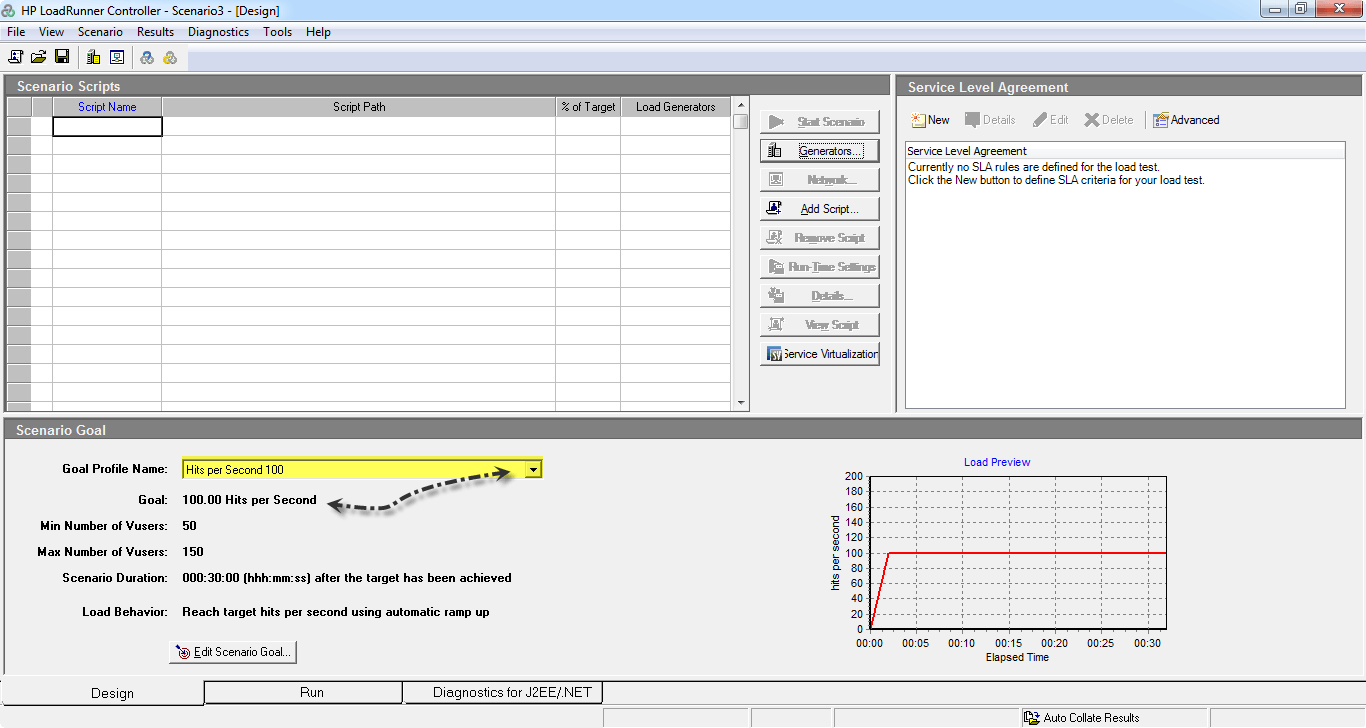
Since a VUsers script will be run by a group of VUsers, hence it is called a Group as well. The Group Name column will show the name of VUser Script once added. Let’s add our VUsers scripts into this scenario.
When a scenario is completely created, you will see below toolbar under Scenario Groups:
You can click on the icon in the toolbar to add a VUser Group.
When you click on a cell under Group Name column, it will open a small box i.e. – here you can see a quick list of recent VUser Scripts as well as Browse button. Refer to below screenshot.
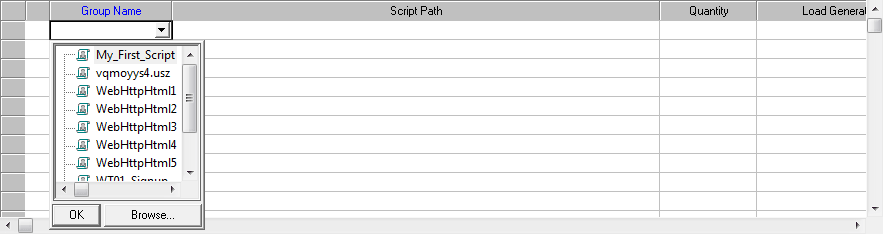
You can select from the list or simply browse from desired directory. If you click the browse button, it opens a dialogue box similar to MS common dialogue box. Refer to below snapshot:
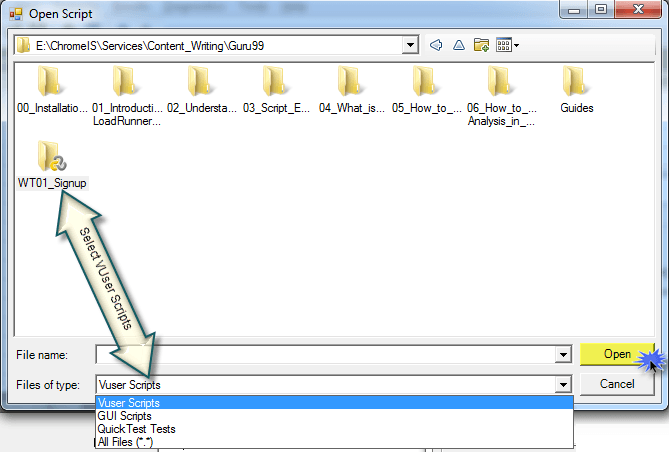
As you can see, you can browser VUser Scripts, GUI Scripts or QTP Scripts here. Please remember, a GUI or QTP script can only instantiate single user and cannot be used for “load simulation”. Can you tell yourself why a QTP script is available in Load Scenario?
The Correct answer is, QTP scripts can be added to Load Scenario for to extract information:
Since LoadRunner script works based on request and response, this doesn’t include UI and data rendering duration. A QTP script will give 1 sample of Real user experience under load. Of course, the QTP script needs to have all the transactions applied through descriptive programming.
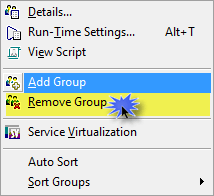
If you right-click on the grey area on the left, you will see a small menu appearing as in below screenshot:
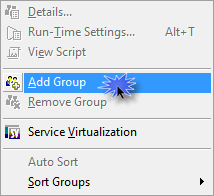
You can click on the Add Group to browse your VUser script.
To remove a group, click on button in the tool bar or right click on the group and select Remove Group – as shown below:
Tip: You can also click on button to view Run Time Settings specific to the selected group. You can select multiple groups (by holding Ctrl + click) to apply Run Time Settings to selected groups at a time.
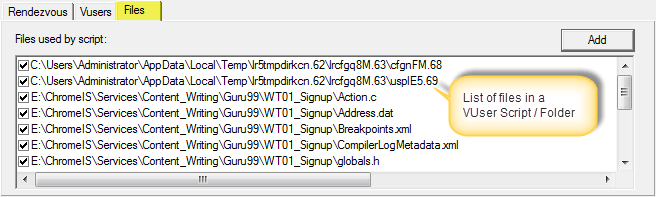
From the toolbar, you can click on Details button [ ] in toolbar to view all details pertaining to a VUser Group.
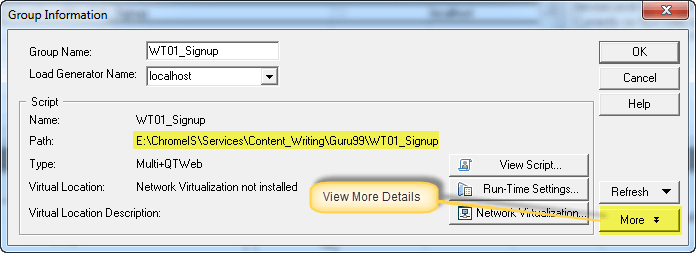
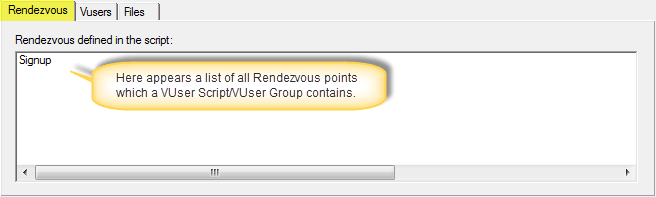
If you click More, it will show you a panel with 3 tabs. 1st tab, Rendezvous, will open by default:
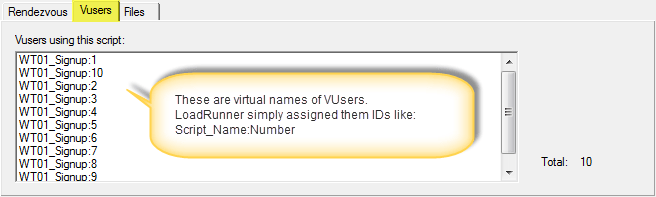
You can also see the VUsers a list in Vusers tab. If you’ve assigned IDs to VUsers, you’ll see them here.
You can also see list of all files in the Script folder. This helps to navigating all the way to the end directory and see only relevant files.
We will study how to Schedule a group separately.
Once your scenario is ready, you can click on button to start executing your scenario. Once you click the play button, you will notice the Controller switches from Design tab to Run tab.
Controller design the view also gives view a script as you run the scenario. This is helpful when you face errors. However, any changes you make in the script will not be reflected the running scenario. Even when the scenario is not running, you need to view the details and click on REFRESH button for changes to take effect.
You can view a script directly from Controller by clicking on button.
Likewise, you can see the current VUsers (yes, you can actually view them) by clicking on button.
Once you’re good with configuration, you can hit the button or go to Running tab and click on button.
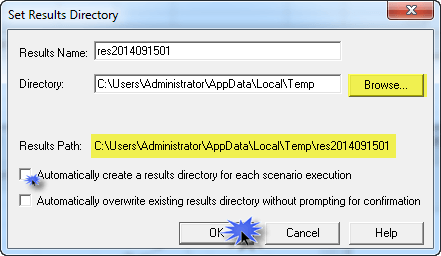
At the start of execution of the scenario, Controller will implicitly create a temporary directory to dump the results. If the directory already exists, you will get a prompt:
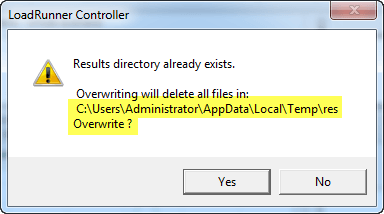
If you select Yes, the previous dump will be lost. If you select No, you will see below window. You can opt to create a new directory for each result if you wish. However, consider running out of space shortly after that.
As soon as you hit OK, your scenario will start running. You will see users moving from Pending to Init columns and so on.
This is how an example execution will look like:
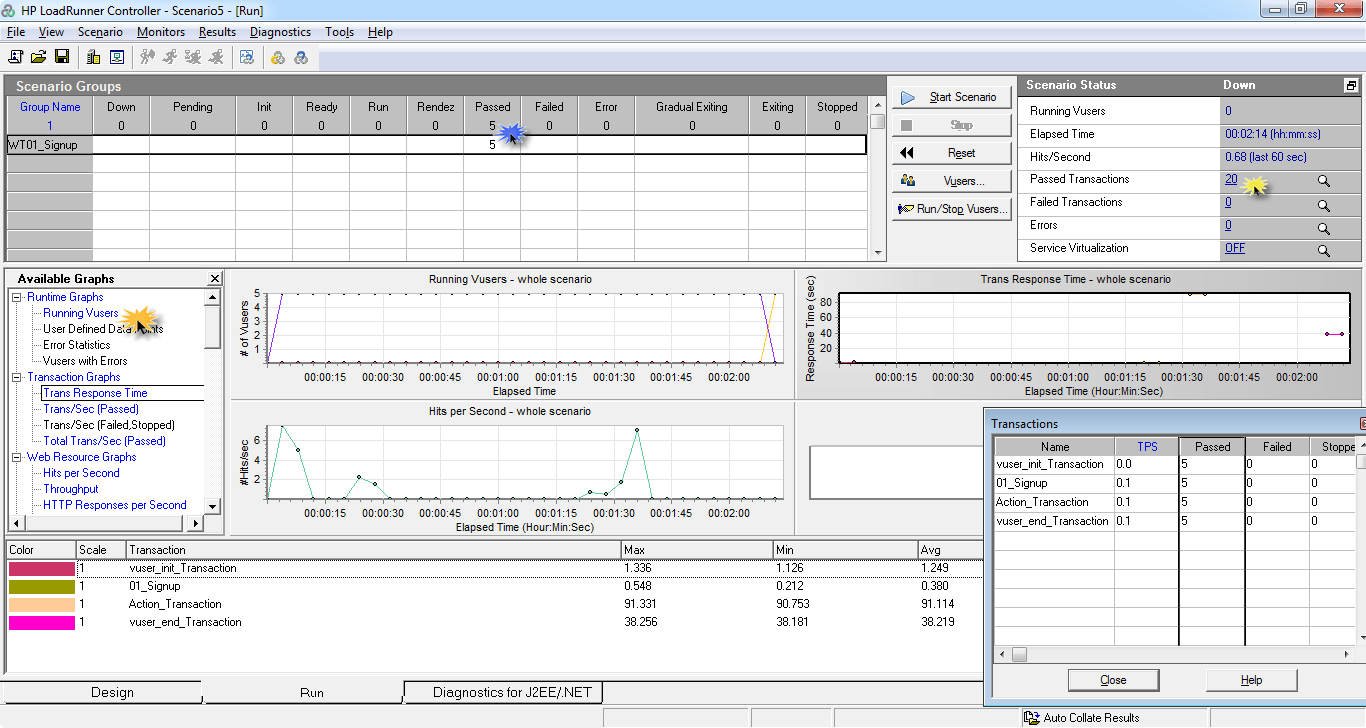
You can click on the Passed Transactions that opens a new window. Here you can check the status of transactions which you’ve applied throughout your scripts.
Similarly, you can click on any graph name on the left to open any graph.
In the bottom of the window, you can see which Transactions are passing, the minimum time taken by any user thus far, the maximum time, average time and standard deviation.
You can choose to collate results side by side or only after the end of scenario completion. For toggle, click on the Results menu and you will find below menu.
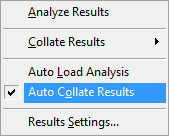
If you’ve wished to enable collation, you can keep it checked.
Simulating a Goal-Oriented Scenario
A Goal-Oriented scenario is dynamic in nature – this means, it keeps changing the overall load being simulated over the server. You set a Goal, for example, the maximum number of hits you wish to achieve for the target server, maximum response time against a transaction etc.
Based on above numeric, you can draw analytics such as a maximum number of users your application support while staying between acceptable response time. Similarly,The maximum number of users connected to application till X number of hits to the server is reached.
In such a case, HP Controller automatically varies the number of users to the server, thus, you’ve little control over how many numbers of times or for how long a user runs.
Click New to create a new scenario and select Goal-Oriented Scenario.
The following screen will appear:
Process of adding VUser Groups is exactly same as in case of Manual Scenario.
The key differences in Goal Oriented Scenario, as the name suggests, is to create a goal. The Controller will automatically
While most of the interface is pretty much similar to Manual Scenario, certain screen appears differently, although perform the same actions. For example, to add a VUser Group or a VUser Script, click on the button. This will lead to below window:
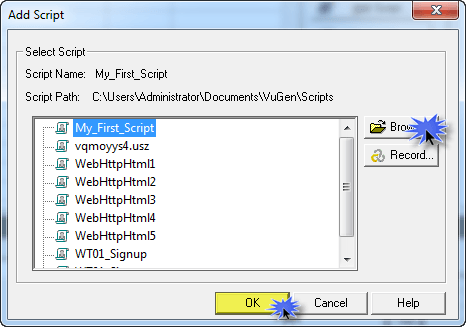
Here you can select recent scripts, browser a script or hit the Record button to create a new script.
Click OK to close the window.
Per need, you can click button to view the details of selected group/VUser Script.
Clicking button will remove the selected VUser Group from the current scenario. The changes will be saved only if you save.
Clicking button will open the Run Time Settings, as we studied in VUGen. However, if you override (or modify) the Run Time Settings here, the changes will be effective only for the current scenario. If you remove the script and reload, or hit refresh (in Details View), you will lose any changes made. This will reload the Run Time Settings saved while creating the script.
You can also click on button to open select VUser Group in VUGen.
If you wish to configure Load Generators (our next topic) you can click on button.
Execution of a Goal-Oriented Scenario is same as Manual Scenario.
Configure Load Generators
There are two ways to configure Load Generators.
When you click Add Group ( to add a VUser Script), you will see below window:
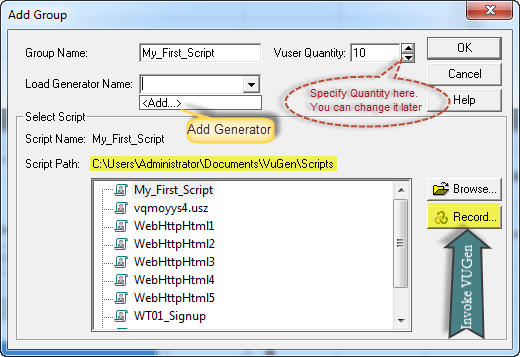
You can click on Add corresponding to Load Generator Name and browse your Load Generators, or alternative, you can simply a type “localhost” and start using your controller machine as Load Generator.
If you click on “add…”, you will see below window:
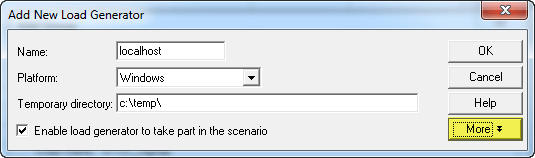
You can click on More to see more settings related to Load Generator. Navigate through different tabs to build more understanding:
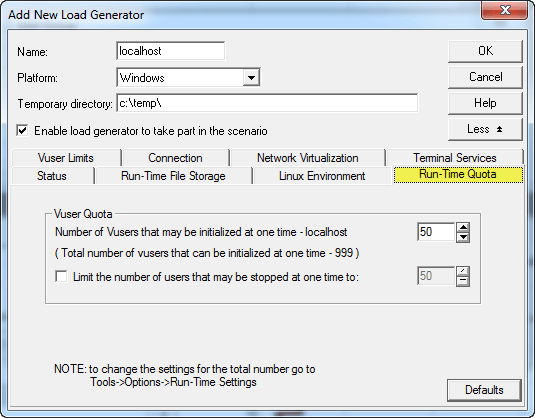
The above were configurations to Run-Time Settings. As you can see, a maximum of 50 users can be initialized at one time.
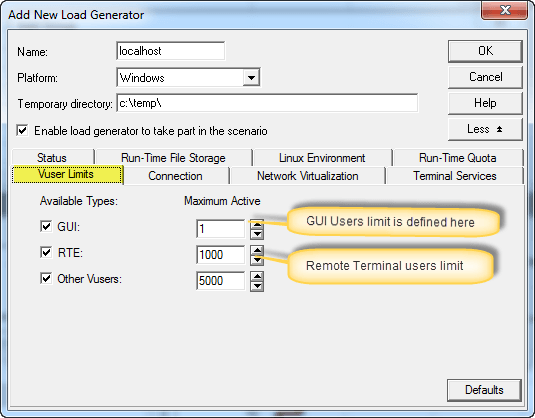
Below is configuration of VUser Limit.
Click Defaults if you wish to revert to default settings and lose any changes you’ve made. Click OK button to save changes and close window.
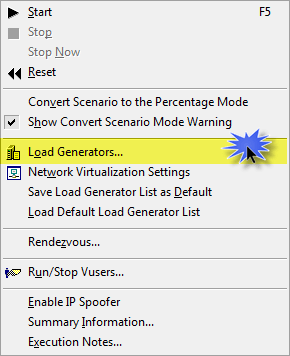
Another way of adding and configuring Load Generators is by clicking Scenario menu and click Load Generators.
This will lead to main window of Generators. Here you can see the status of all Load Generators. The name refers to the name of the Generator. The Status is the current status, whether or not the generator is ready to be used. The Platform tells the Operating System of the generator which can be Windows or Unix only. The Type tells whether it’s local or Cloud based generator. Have a look at the below snapshot:
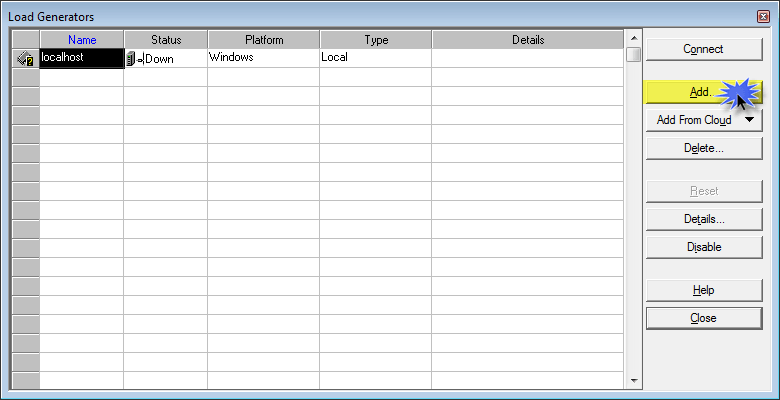
To add another generator, you need to click on Add button. Once you click add, you will see the same screen as already discussed above.
Once generator has been configured, click Close button to close the screen.
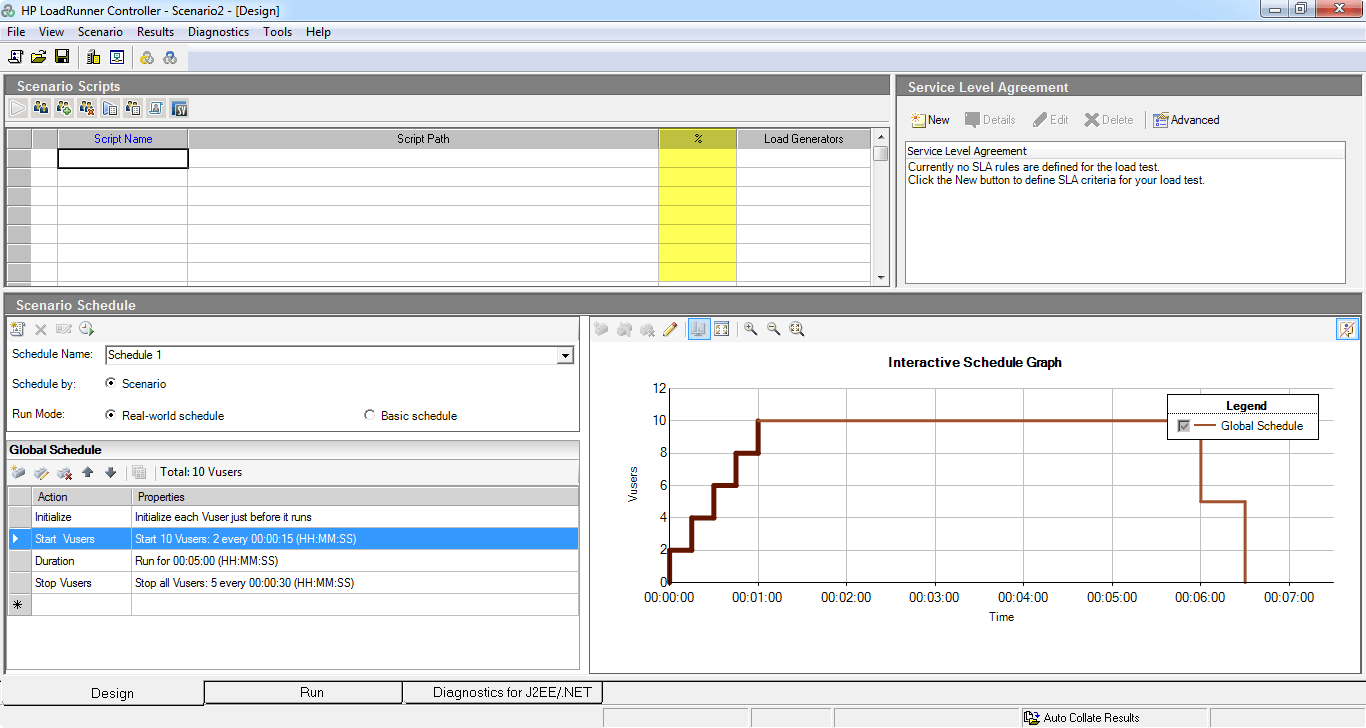
Schedule a Group
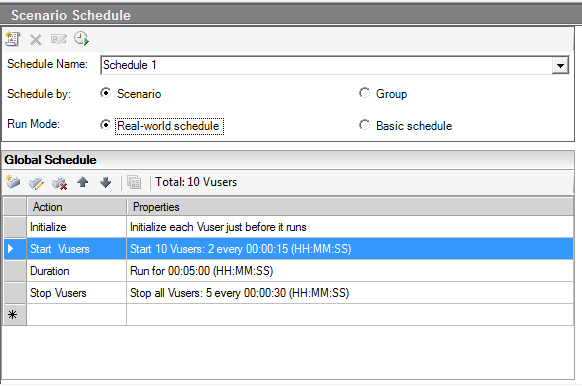
Before you run your scenario, you need to configure schedule. Either you schedule by Scenario or by Group. Each of these, can further be categorized by Real-world Schedule or Basic Schedule, called Run Mode.
If you schedule by Scenario and create a Real-World Schedule, you will see below options appearing in Global Schedule area:
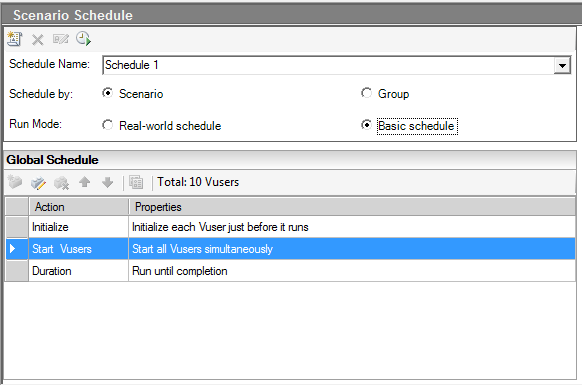
However, if you schedule a Scenario and create a Basic schedule, you will see below window. Can you find difference?
You can also Schedule by Group. This will apply the configuration to group level. This can further be categorized as Real-world and Basic Run Mode.
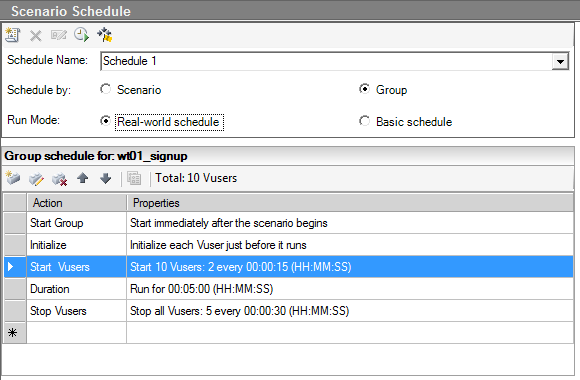
Likewise, you can change the Run Mode to Basic Schedule. Use your Test Designing skills to find the difference between the two. Here is a reference:
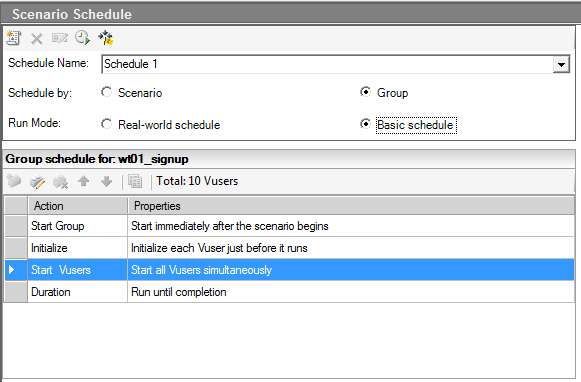
Did you notice a new icon appearing in the Scenario Schedule toolbar?
Here it is for your reference:
The Rendezvous icon is appearing only in case of Group configurations.
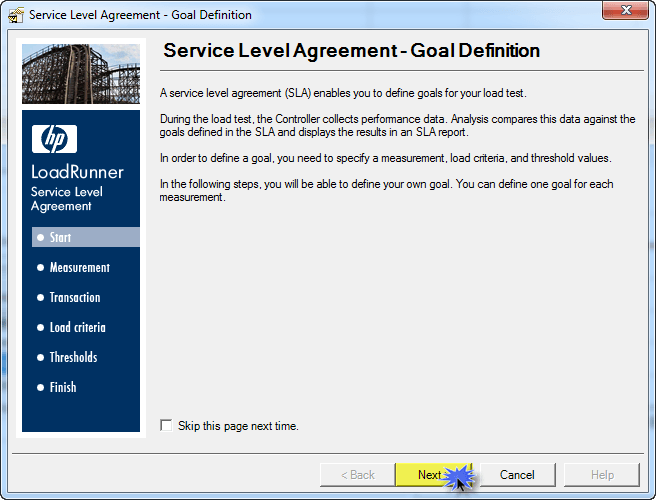
Set-up the SLA(Service Level Agreement)
You may have signed a Service Level Agreement with your customers. The SLA in LoadRunner or Controller gives an opportunity to you to test your application against an SLA. Keep in mind, a regular (non-SLA) scenario gives you the opportunity to run various types of scenario in order to find the problems and root cause of problems; whereas, your customers might like to simply test your application under an SLA to see whether it works assigned in contract or not.
From the main Design View of Controller, find the SLA toolbar; that is on the right top corner and looks like this:
Click the button and following window will open up:
Click the button.
Notice the new window. Here you can select the Measurement of the SLA. In our example, we’re taking Transaction Response Time. Have a look:
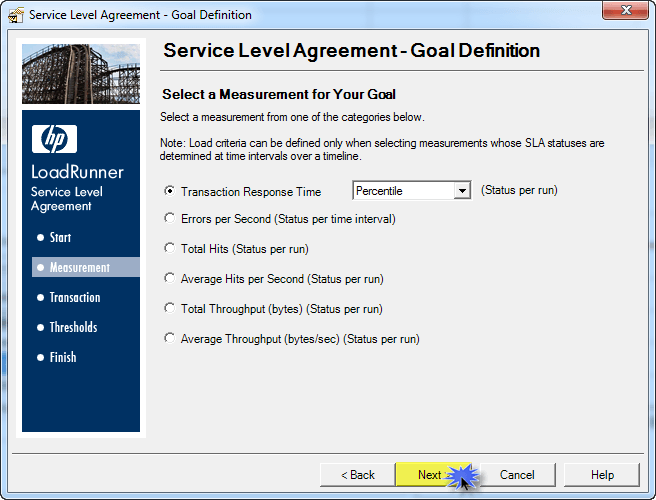
Click the button.
In the next window, you can select the Transactions where the above Measurement will be applied. We’re using only main transaction i.e. 01_Signup
This will help remove opening main page and other not so important transactions to be excluded.
Have a look at the window:
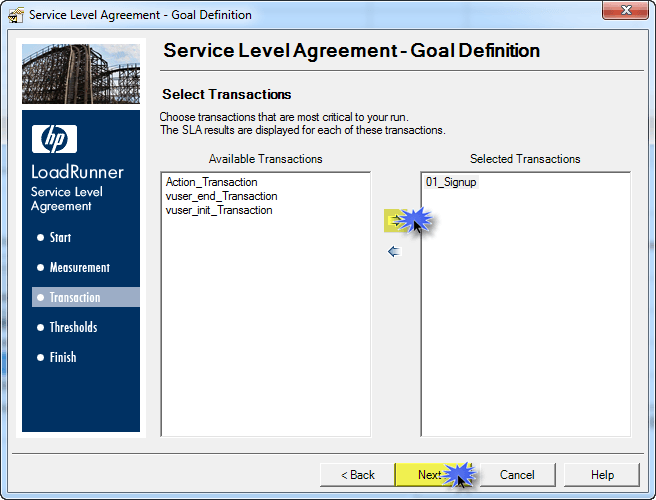
Click the button.
In the new window, you can select the percentile of the threshold value. If you’ve selected multiple transactions, you can click button. Have a look at the below window:
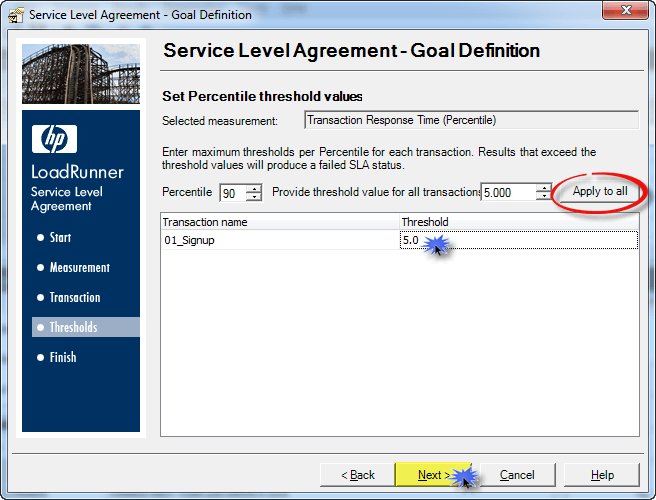
Click the button.
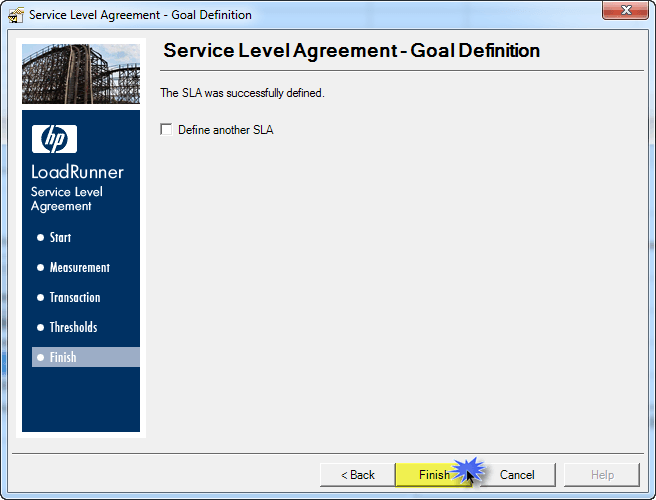
The next screen is a plain closure. Click the button to close the SLA.
After you click , you will see the main, Design Window of Controller with an SLA appearing. Have a look:
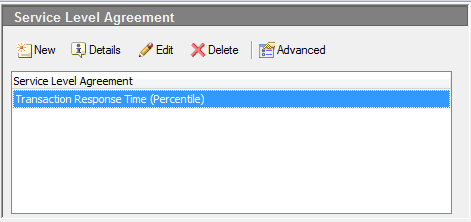
You can click on the buttons to view SLA details. The Following window will open up:
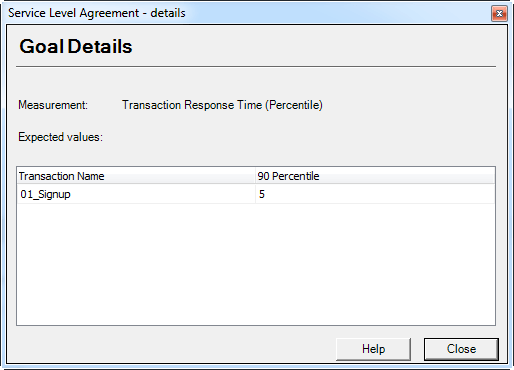
Click button to close the above window.
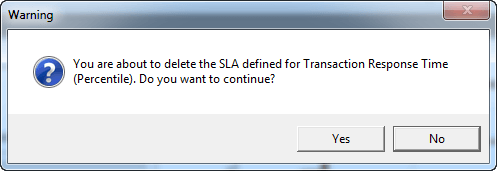
If you wish to delete an existing SLA, you can click on the button. Upon clicking, you will get to see below confirmation message:
If you click on the button, you will see Advance options of an SLA.
It is advisable that you work with default option i.e. Internally Calculated Tracking Period. Have a look at the snapshot:
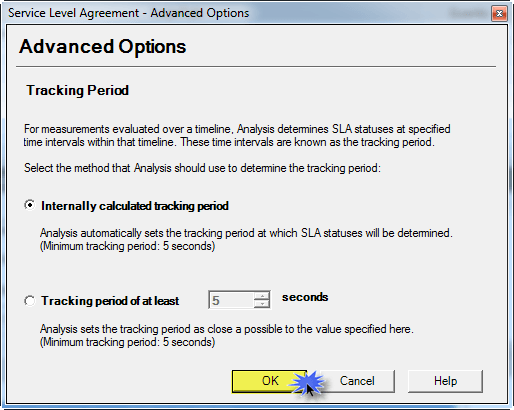
If you work with Internally Calculated Tracking Period, Analysis automatically sets the tracking period at which SLA statuses will be determined. This option has minimum tracking period set to 5 seconds.
On the other hand, you select Tracking Period to the desired number of seconds. Simply select the next radio button.
When executing an SLA based scenario, the execution process remains exactly the same.
1. How to use Analysis in LoadRunner
HP Analysis, as the name suggests, is a program to perform detailed (literally, very detailed) analysis on the performance test you’ve carried out.
HP Analysis takes the dump created by Controller, during execution of your load test. The dump contains all the information in a raw format which is parsed by HP Analysis to generate various graphs.
Let’s learn more about HP Analysis.
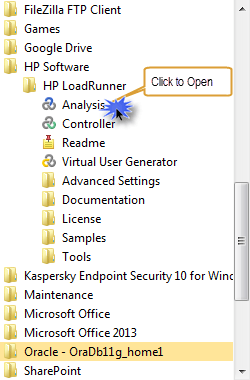
To launch HP Analysis, go to Start Menu =>HP Software =>HP LoadRunner =>Analysis as demonstrated below:

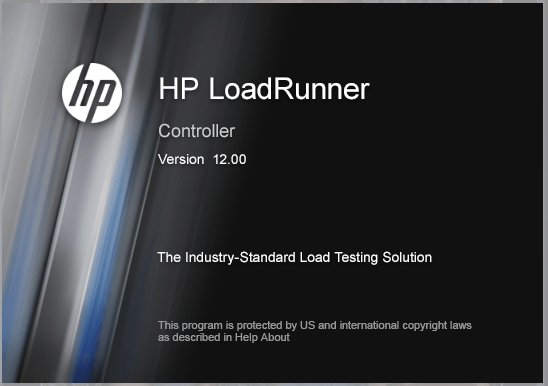
This will launch Analysis. As usual, at first a splash screen will open as shown below:

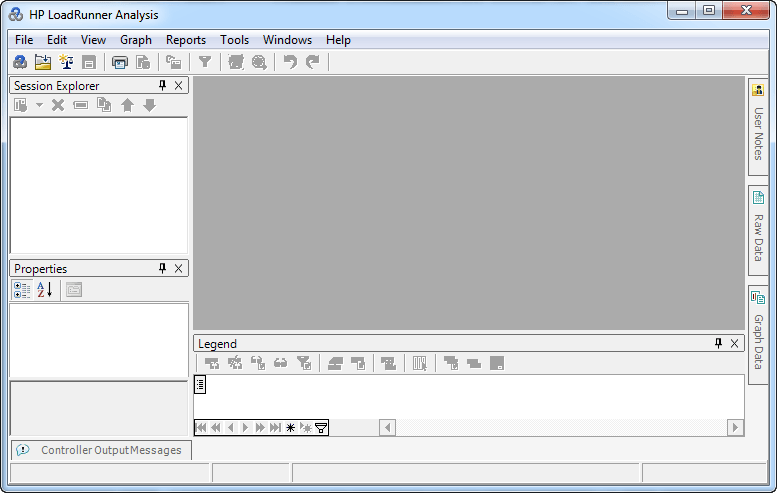
After a moment, this splash screen will automatically lead to the main screen of HP Analysis. The main screen will open in restored mode. Refer to below snapshot:
Click on the File menu and you will see a list of menus as in below snapshot:
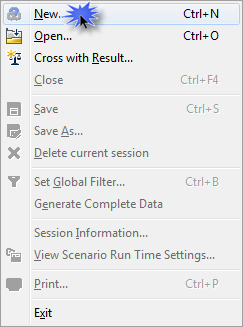
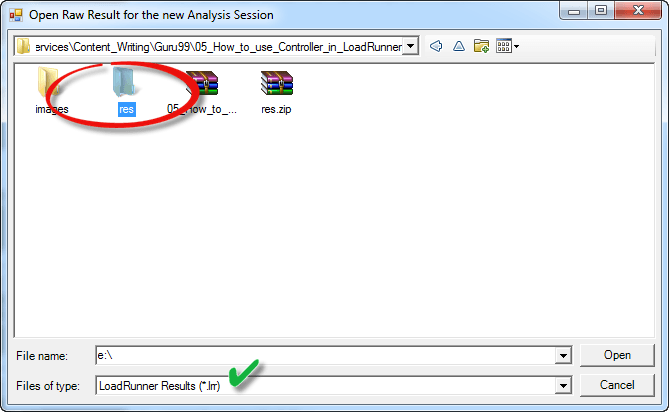
Click on the File Menu or use Ctrl + N to open create analysis session. This will open a dialogue box to help you locate the lrr file. The file extension, LRR stands for LoadRunner Results.
Remember HP Controller creates a repository of results in a folder? That folder contains the lrr file.
Locate the res folder of the scenario for which you wish to create analysis session. A snapshot has been provided below for reference:
As soon as you select the correct file, HP Analysis will first check for available disk space to ensure you don’t run out of space during the process. This is because the size of a session can be very large especially for complex scenario where you’ve included multiple VUScripts and run for long hours.
Below window will open momentarily:
Immediately after affirming availability of disk space, HP Analysis will come to action and you will see a “currently analyzing” window, as shown below:
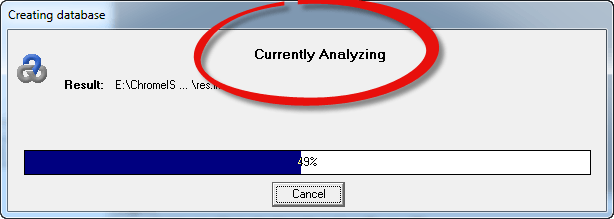
The time taken by above window depends upon the size of result folder (or statistics contained in that folder)
If it takes way too long, or gets stuck, you can opt to cancel by clicking on the cancel button.
Once finished, this will automatically lead to a quick window where format template will be applied:
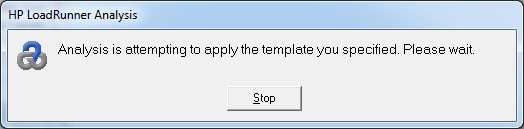
This should quickly lead you to main window of Session Explorer. However, if you’re using some complex custom template and the operation halts for any reason, you can click on the Stop button to cancel the operation and start over.
2. LoadRunner Analysis Summary Report
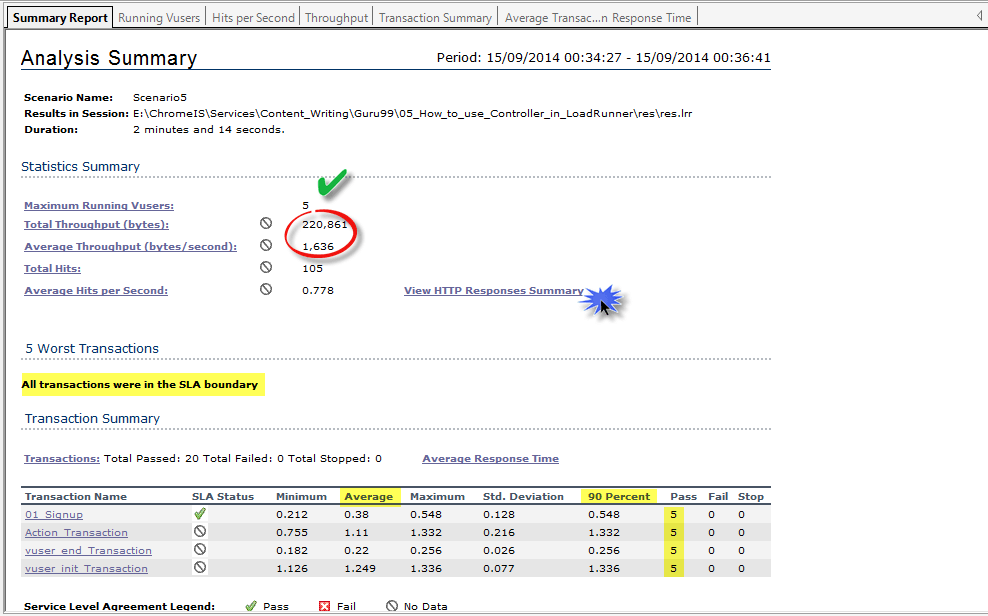
Once the operations completes, you will see main session window which looks something like this:
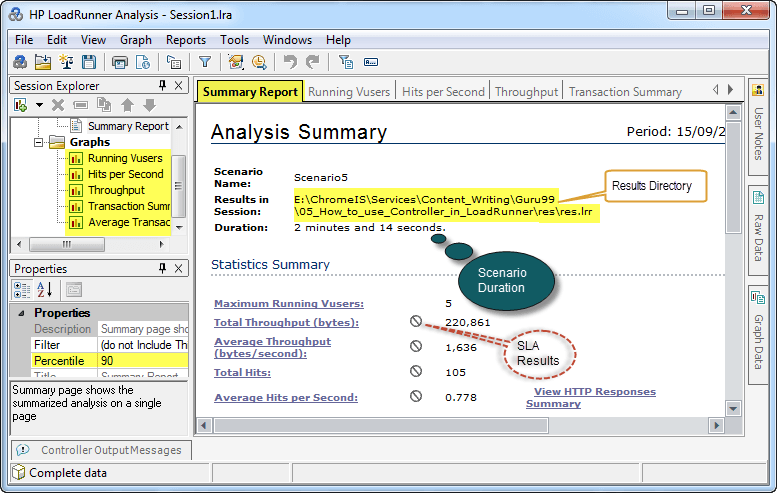
Here you can see the directory where you picked up the results from.
You can also see complete information about your scenario within Analysis session. In the Summary Report tab, you can see the duration of the scenario which was run to get these results.
The term percentile is used in analysis almost with every graph. You can define the value for percentile in the properties panel. The default is set to 90.
Notice the graph section in Session Explorer:
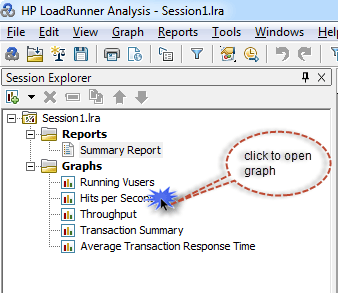
Few graphs appearing already. You can click on the graph name and you will see its details appearance.
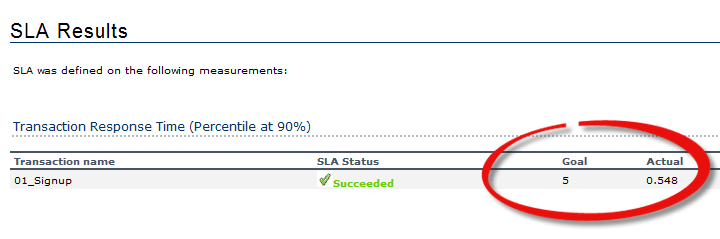
From the Summary Report, you can click on the button to open its SLA related information, if available.
Upon clicking, you will see the below window:
You can locate the toolbar just below File menu on the top, it looks like this:
All the buttons in the toolbar perform some action from within the File menu.
HP Analysis contains every bit of information about your scenario, including Run time Settings. As you’re aware by now that Run Time Settings have significant impact on performance, you can view the settings from within Analysis which were used to run the scenario.
To view the Run Time Settings, click on from the File Menu or button from the toolbar.
The Run Time Settings will be displayed as below:
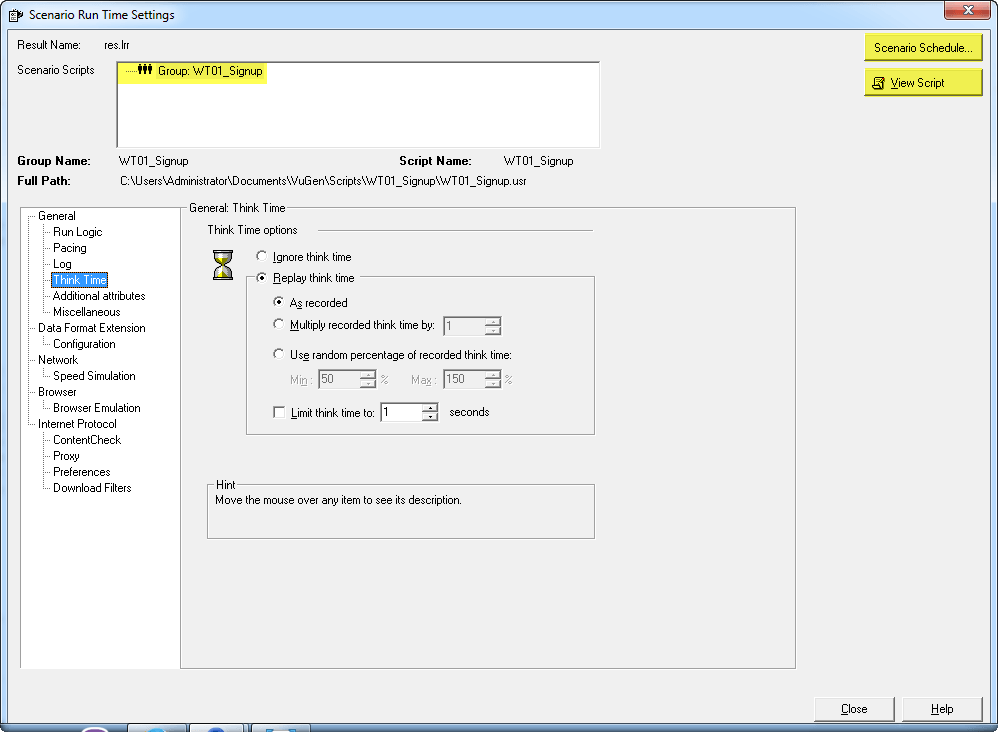
As you can see, not only all the settings can be seen from within this window, you can also open the Schedule by clicking on button or view script by clicking on button. To close the window, click on button.
3. Analysis Graphs
HP Analysis will load most important graphs at the time of Analysis. You can click on any graph name from the Session Explorer to view details against available graph.
Let’s discuss few graphs one by one.
3.1 Average Response Time graph:
This graph displays the number of hits made on the Web server by VUsers during each second of the load test. This graph helps you evaluate the amount of load VUsers generate, in terms of the number of hits.
Have a look at graph of our scenario:
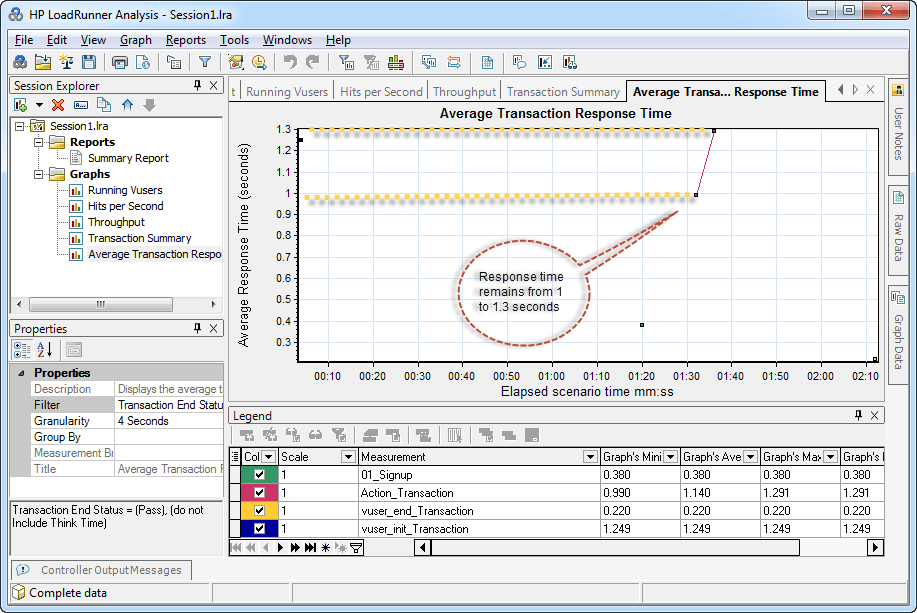
When viewing a graph, it is pivotal to understand the graph legend side by side.
The Legend shows the transaction name, its color, minimum value, average value, maximum value and standard deviation (variance around the mean).
The colors of the graph can be recognized from the Legend.
3.2 Hits Per Second graph:
This graph displays the number of hits made on the Web server by VUsers during each second of the load test. This graph helps you evaluate the amount of load VUsers generate, in terms of the number of hits.
Have a look at the graph in case of our scenario:
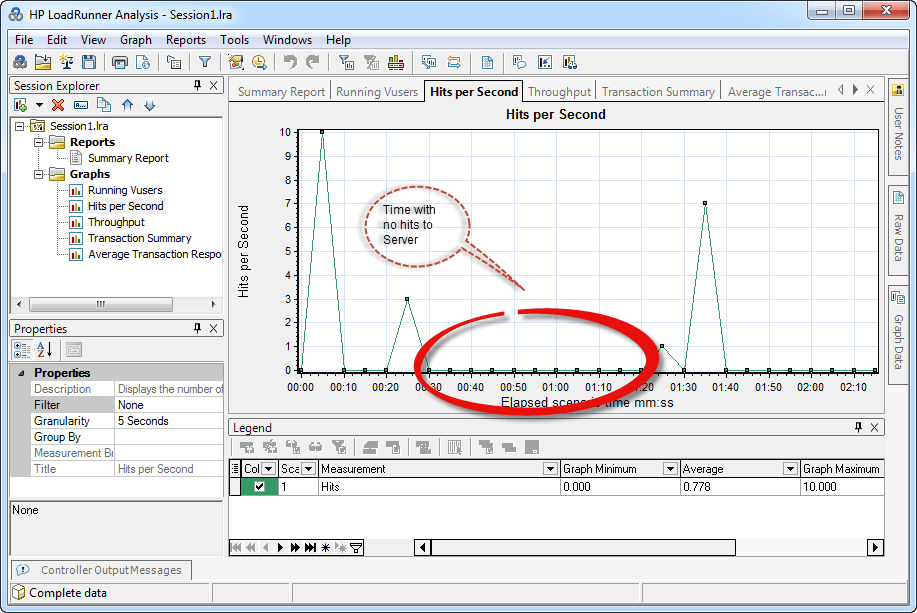
As can be seen from graph as well as legend, that there were times where there were no hits to the server.
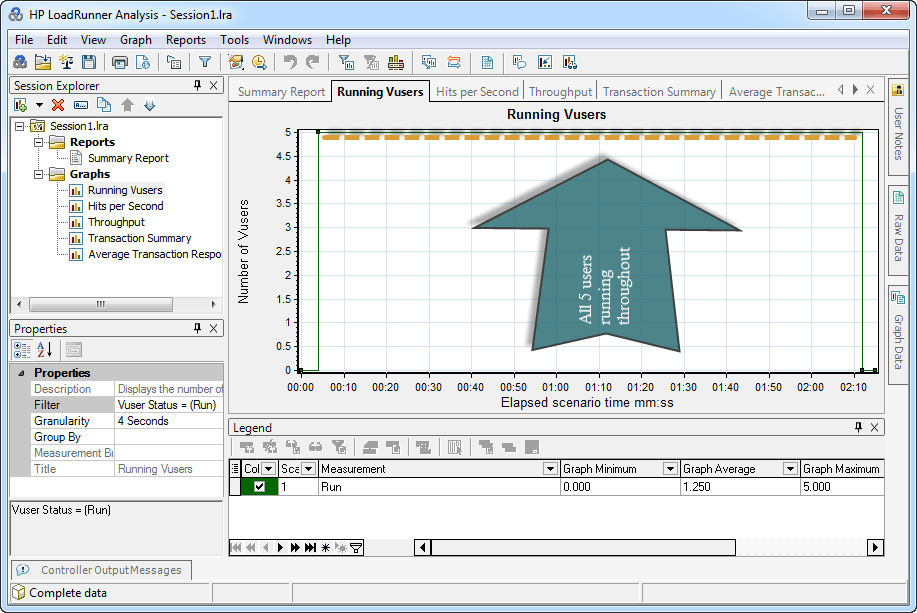
3.3 Running VUsers graph:
This graph displays the number of VUsers that executed VUser scripts, and their status, during each second of a load test. This graph is useful for determining the VUser load on your server at any given moment.
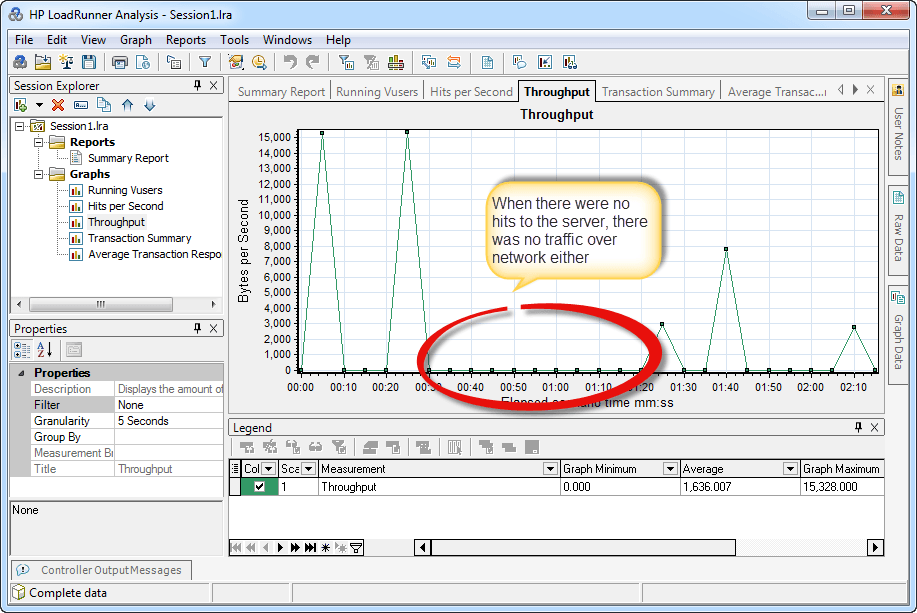
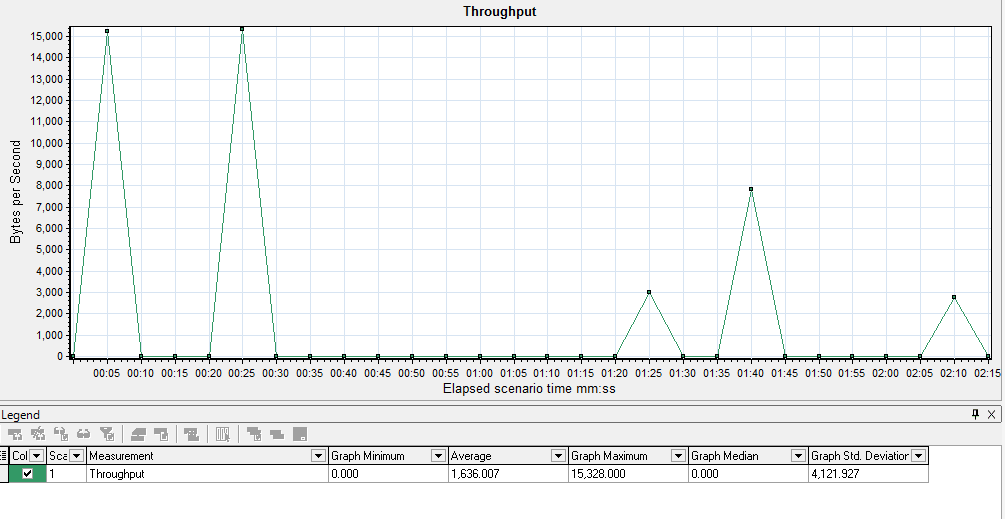
3.4 Throughput graph
This graph displays the amount of throughput (in bytes) on the Web server during the load test. Throughput represents the amount of data that the VUsers received from the server at any given second. This graph helps you to evaluate the amount of load VUsers generate, in terms of server throughput.
Here is description to some more graphs:
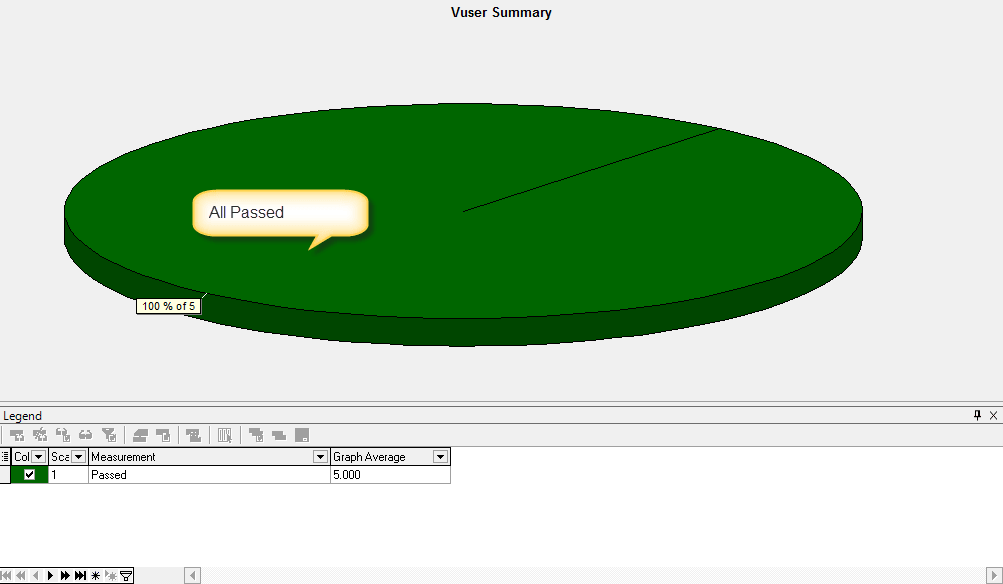
3.5 VUser Summary:
This graph displays the number of VUsers that completed their run successfully, stopped their run, or ended with errors. This is how it looks like:
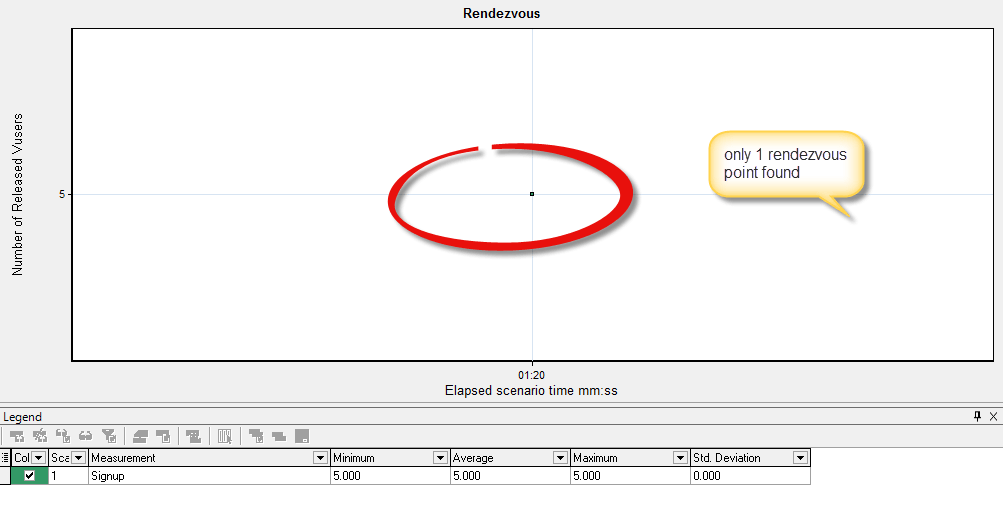
3.6 Rendezvous graph:
This graph Indicates when VUsers were released at rendezvous points and how many VUsers were released at each point. This is how it looks like:
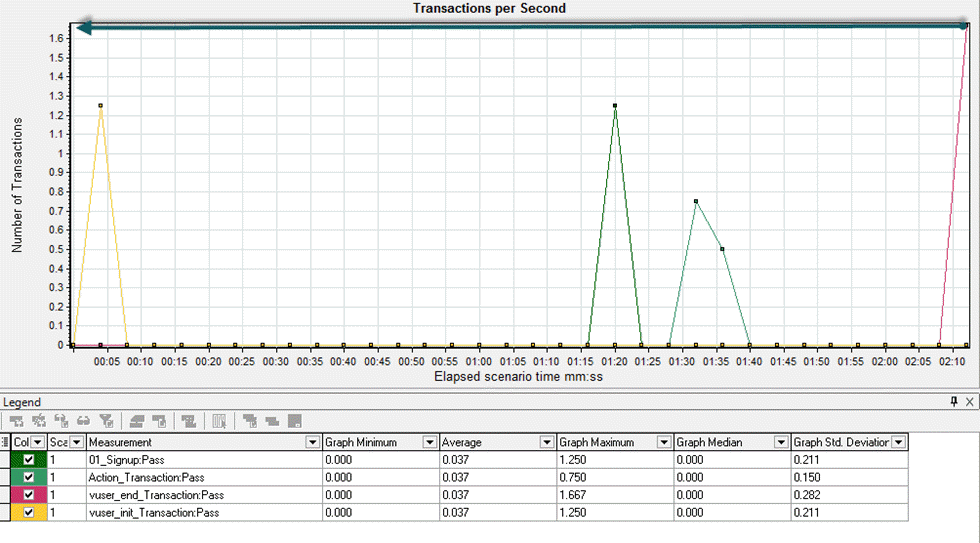
3.7 Transactions Per Second graph:
This graph displays the number of completed transactions (both successful and unsuccessful) performed during each second of a load test. This graph helps you determine the actual transaction load on your system at any given moment. This is how it looks like:
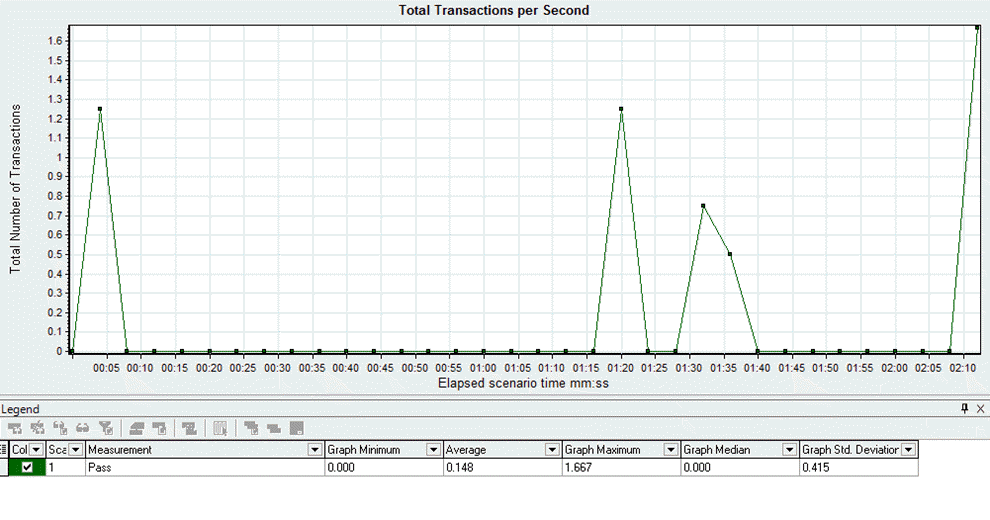
3.8 Total Transactions Per Second graph:
This graph displays the total number of completed transactions (both successful and unsuccessful) performed during each second of a load test. This graph helps you determine the actual transaction load on your system at any given moment. This is how it looks like:
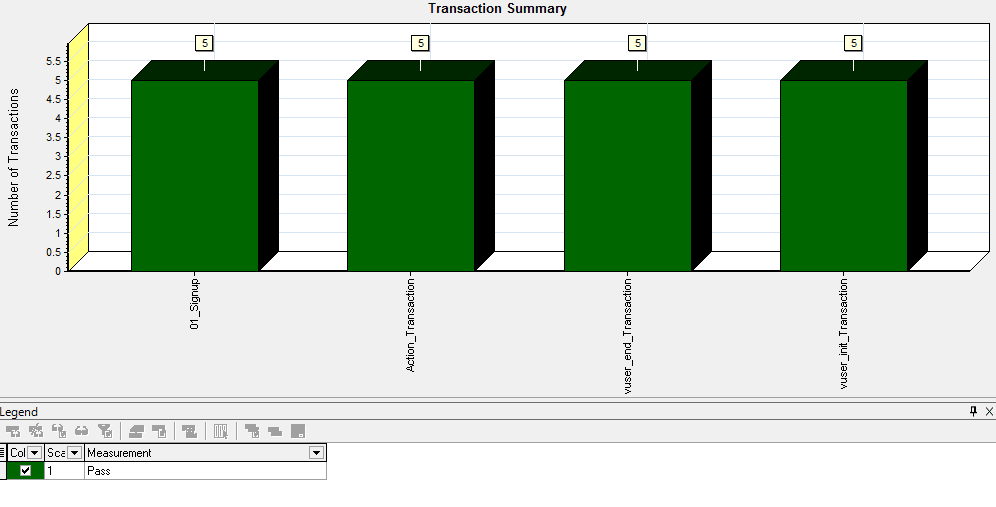
3.9 Transaction Summary graph:
This graph displays the number of transactions that passed, failed, stopped, or ended with errors. This is how it looks like:
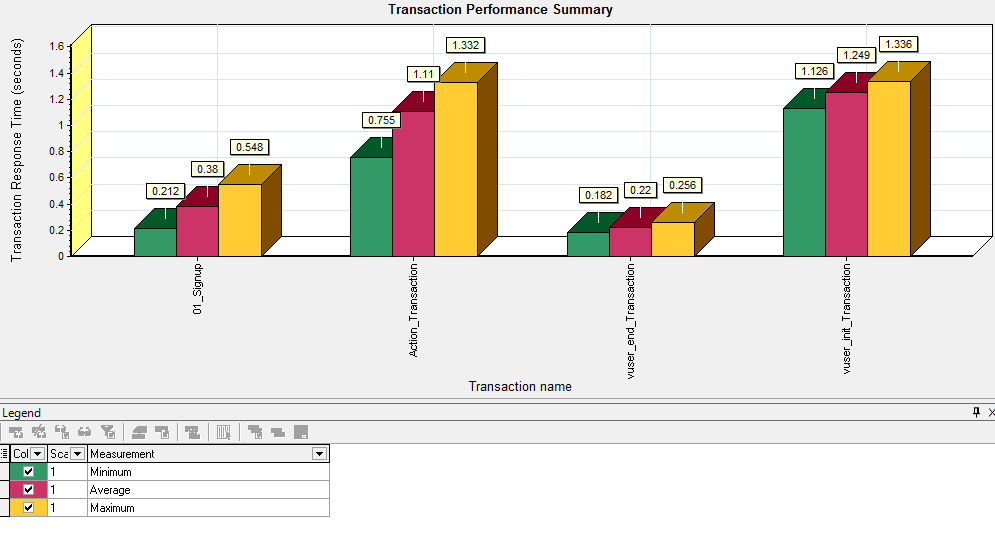
3.10 Transaction Performance Summary graph:
This graph displays the minimum, average, and maximum response time for all the transactions in the load test. This is how it looks like:
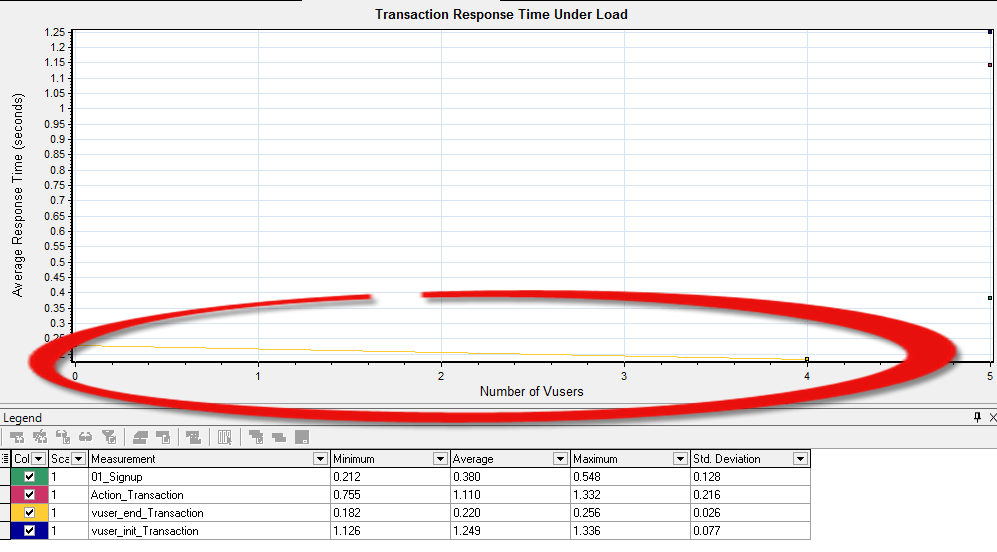
3.11 Transaction Response Time Under Load graph:
Displays average transaction response times relative to the number of VUsers running at any given point during the load test. This graph helps you view the general impact of VUser load on performance time and is most useful when analyzing a load test which is run with a gradual load. This is how it looks like:
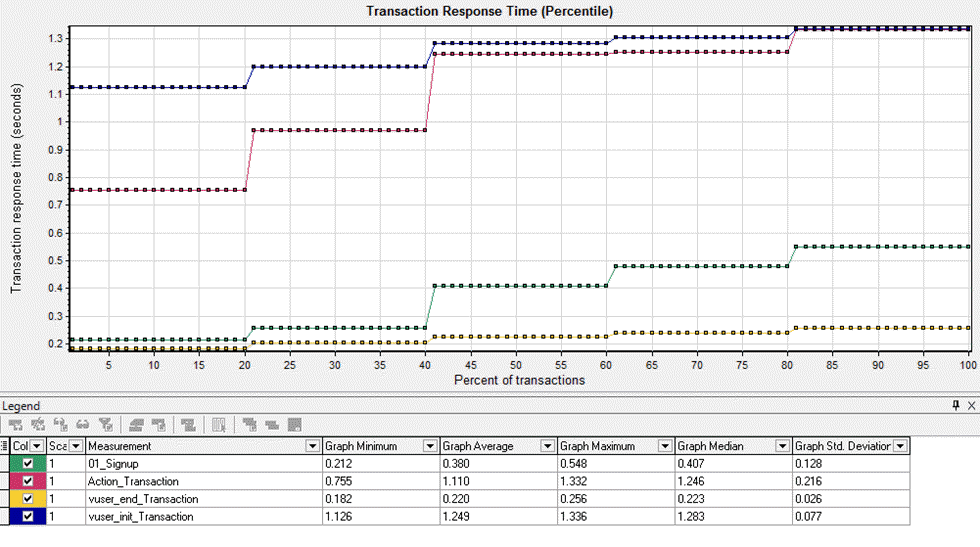
3.12 Transaction Response Time Percentile graph:
This graph displays the percentage of transactions that were performed within a given time range. This graph helps you determine the percentage of transactions that meet the performance criteria defined for your system. This is how it looks like:
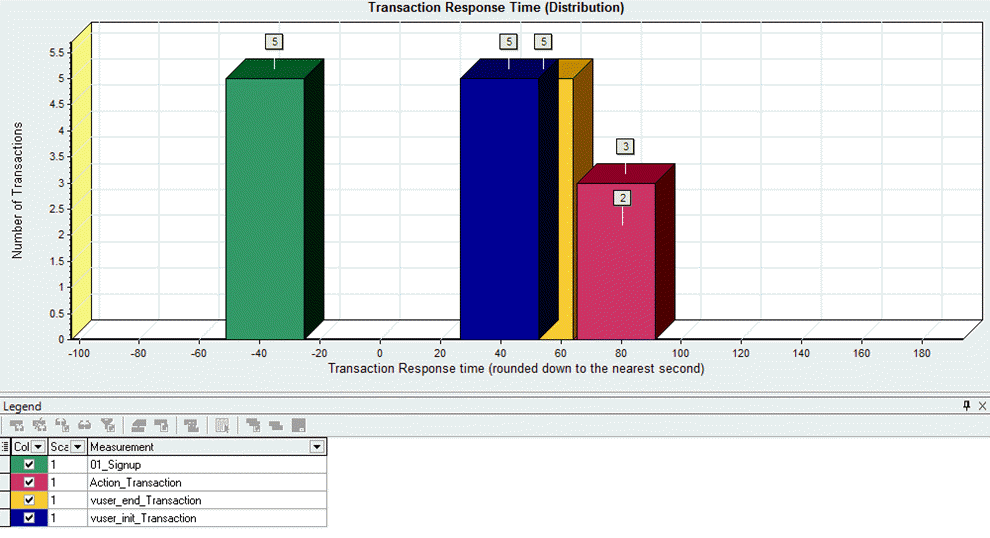
3.13 Transaction Response Time Distribution graph:
This graph displays the number of times a transaction was completed over a distribution of time ranges. Note that this graph only displays information for a single transaction at a time. This is how it looks like:
3.14 Throughput (MB) graph:
This graph displays the amount of throughput (in megabytes) on the Web server during the load test. Throughput represents the amount of data that the VUsers received from the server at any given second. This graph helps you to evaluate the amount of load VUsers generate, in terms of server throughput. This is how it looks like:
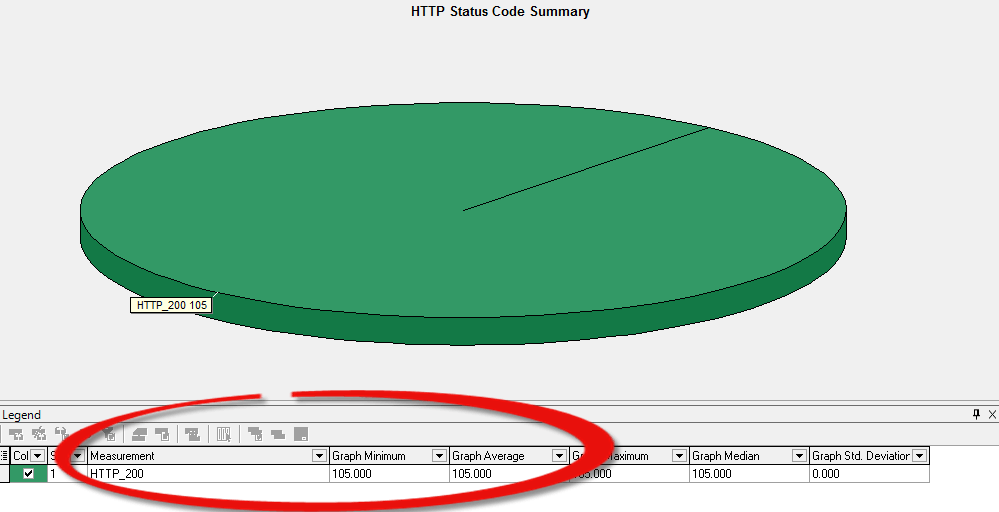
3.15 HTTP Status Code Summary:
This graph displays the distribution of the various HTTP protocol status codes returned from the Web Server during the load test. This is how it looks like:
4
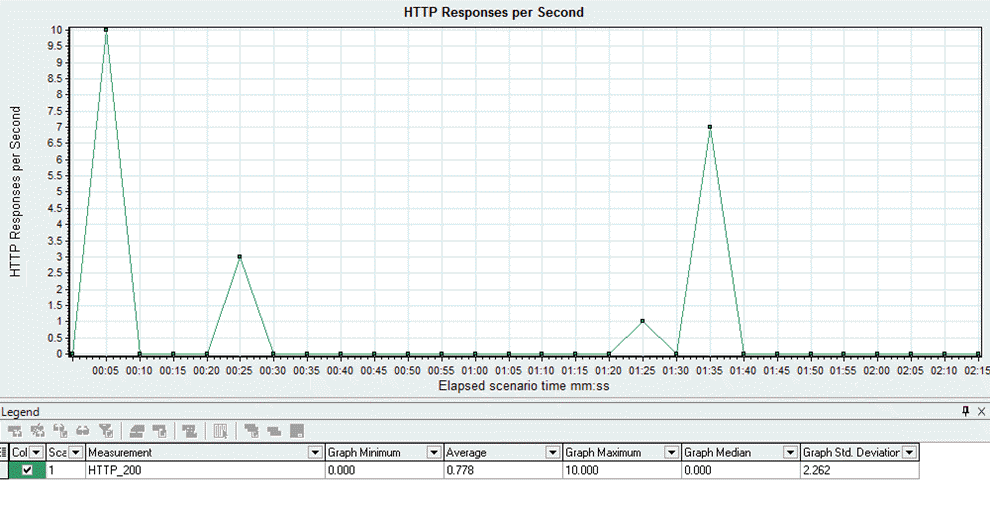
3.16 HTTP Response Per Second graph:
This graph displays the number of the different HTTP status codes returned from the Web server during each second of the load test. This is how it looks like:
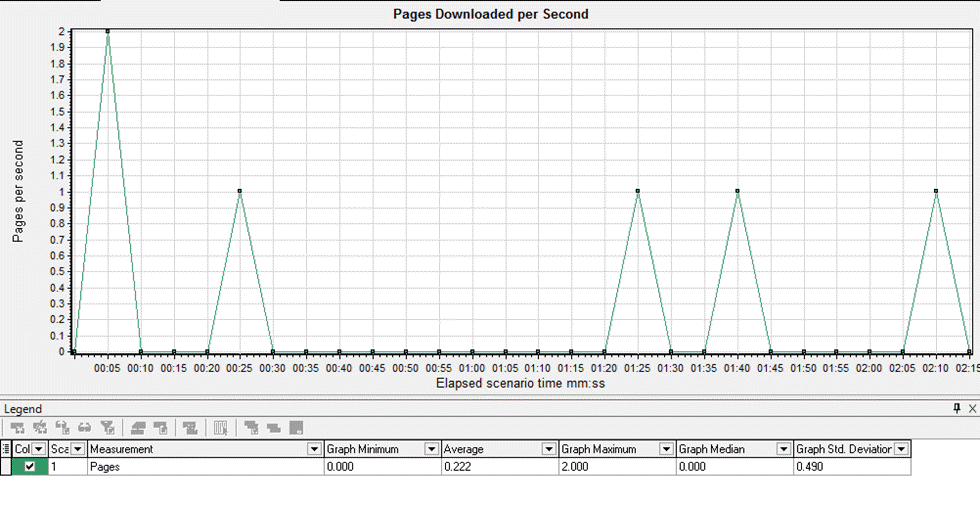
3.17 Pages Download Per Second graph:
This graph displays the number of pages received from the Web server during the load test. This is how it looks like:
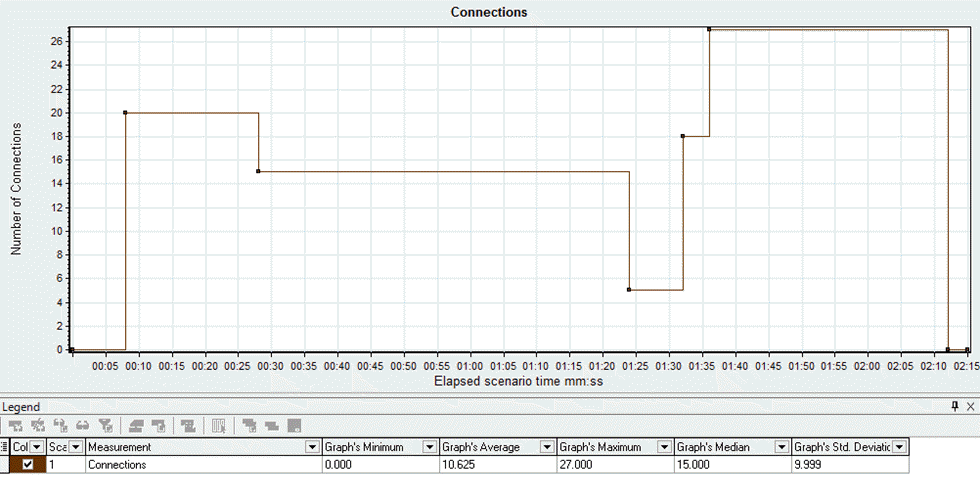
3.18 Connections graph:
This graph displays the number of Connections. This is how it looks like:
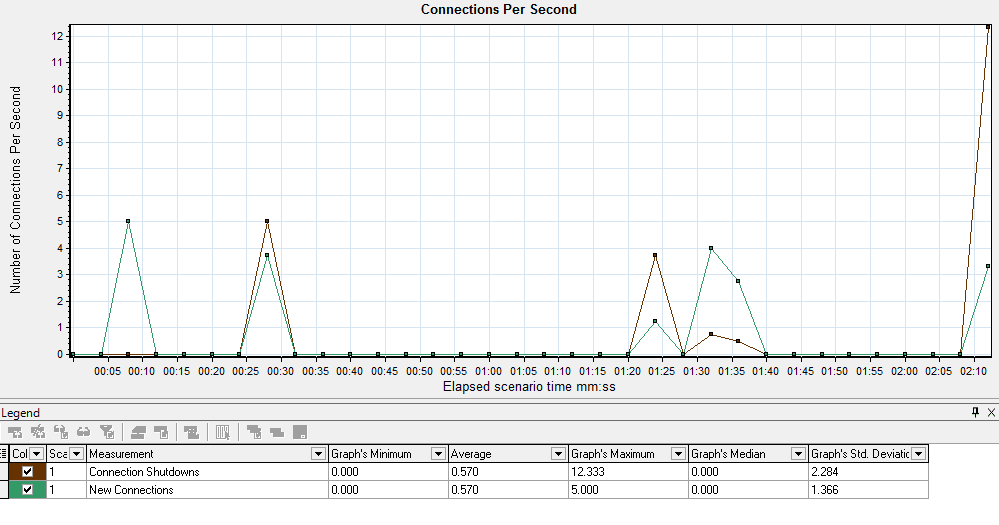
3.19 Connections Per Second graphs:
This graph displays the number of Connections per Second. This is how it looks like:
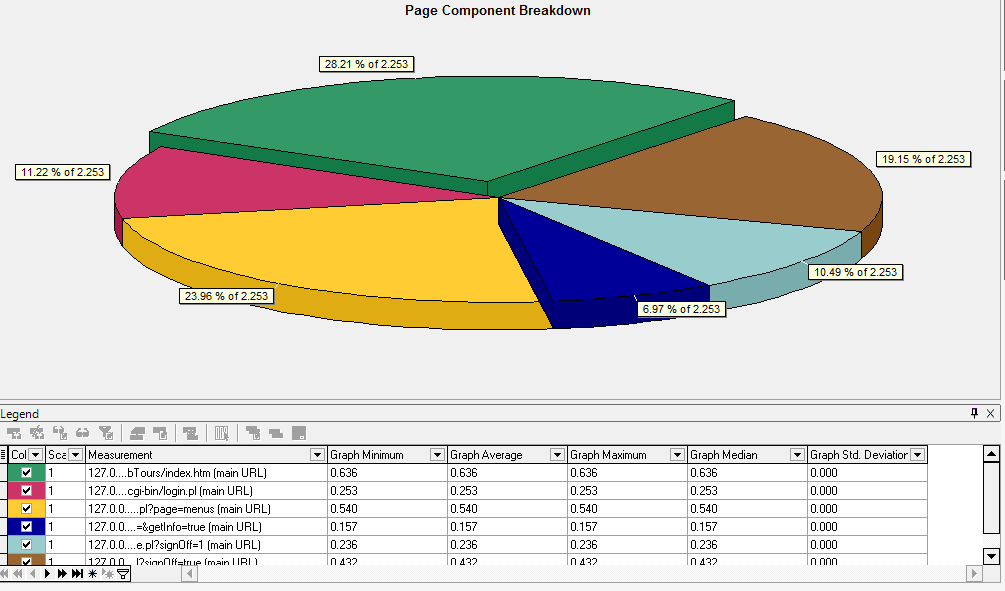
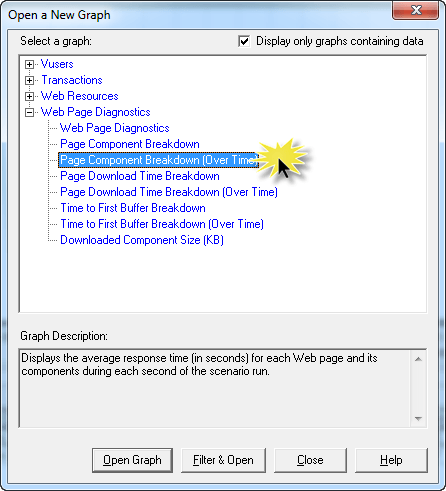
3.20 Page Component Breakdown (Over Time) graph:
This graph displays the average response time (in seconds) for each Web page and its components during each second of the scenario run. This is how it looks like:
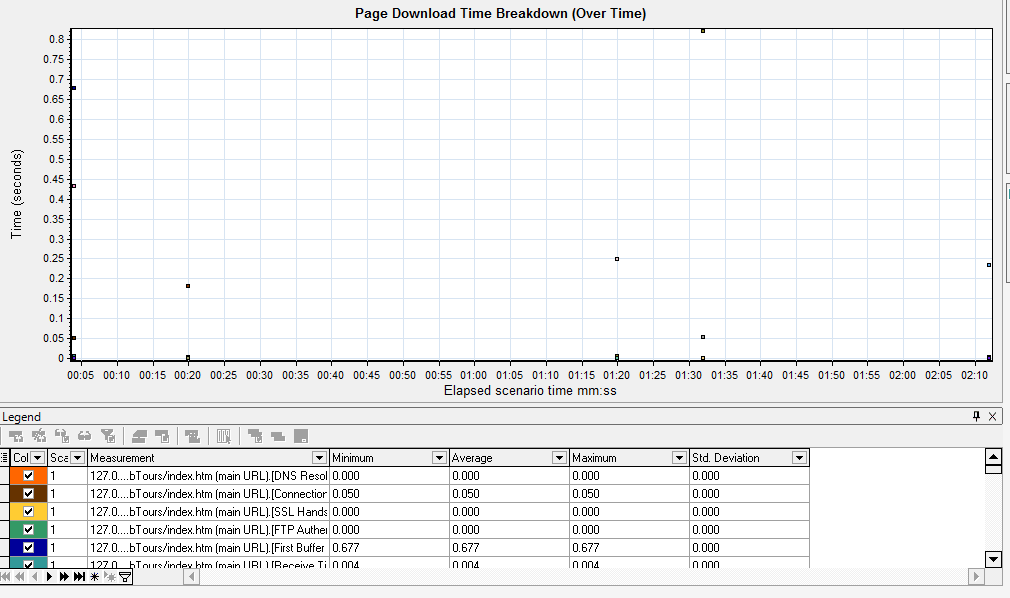
3.21 Page Download Time Breakdown (Over Time) graph:
This graph displays a breakdown of each page component's download time during each second of the scenario run. This is how it looks like:
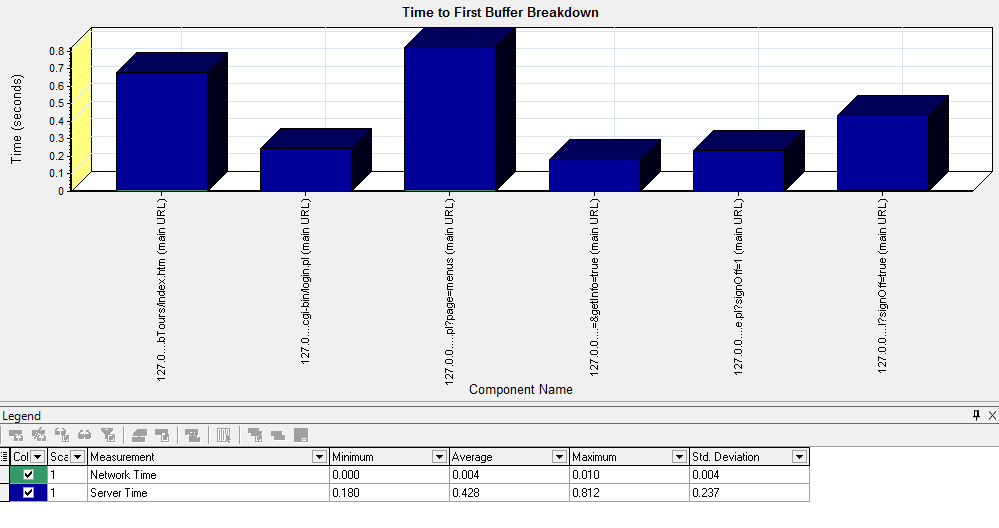
3.22 Time to First Buffer graph:
This graph displays each Web page component's relative server/network time (in seconds) during each second of the scenario run, for the period of time until the first buffer is successfully received back from the Web server. This is how it looks like:
4. Merging Graphs
Two graphs may be required to be merged to bring more meaningful information. For example, as we discussed above in graphs that when there were no hits to the server, there was also no bandwidth over the network.
This can be more easily drawn when merging.
Let’s see how graphs are merged.
Before you open the graph merging option, ensure you have at least one graph opened already, which you wish to merge. The utility will assume you want to add another graph to the already opened graph.
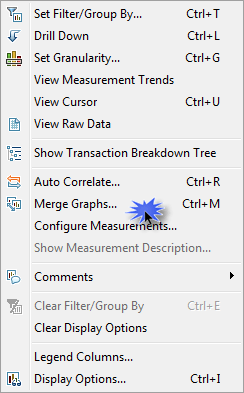
To open the merge graph window, go to View menu and click on Merge Graphs. Here is how the menu looks like:
Clicking above menu will open the main window of merging graphs, here is a snapshot:
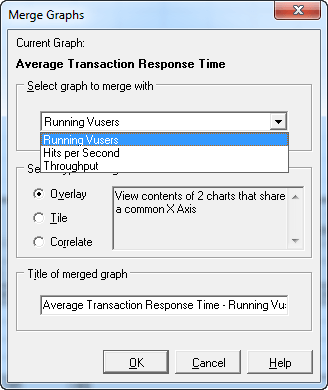
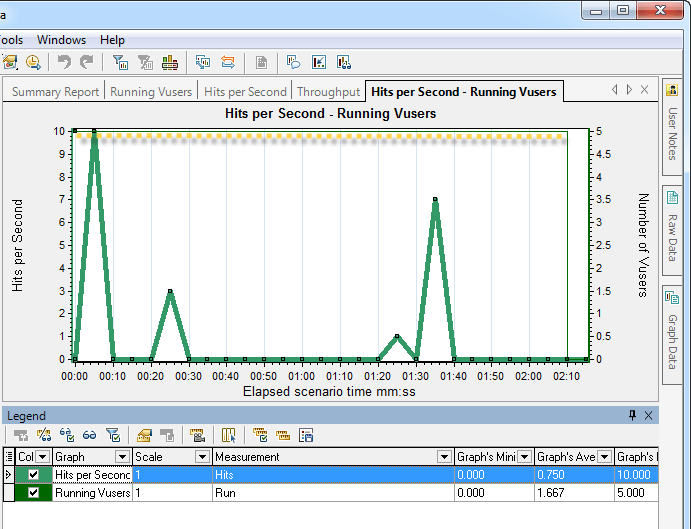
Here, we’re merging Transaction Response Time with Running VUsers graph. The Merge Graph window requires you to provide the name of newly formed merged graph.
Here is how this merged graph looks like:
5. Add New Graphs
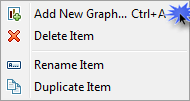
To add new graph, click on the Graph menu and select Add New Graph.
Refer to below snapshot of the Menu:
:
Once clicked, it will open a list of all graphs available in LoadRunner (HP Analysis)
You can select any graph by double-clicking on its name. This will load the graph with values/statistics to the main window of HP Analysis.
Click the Close button to go back to the main window.
Let’s have a look at the window:
6. Crossing with Results
If you’ve multiple scenario runs already, you can use their results folder to cross match the statistics. This process helps directly compare both results and generate a cumulative report.
In order to perform Cross results, click onicon from the toolbar or click Cross with Results from the File Menu.
This will open window:
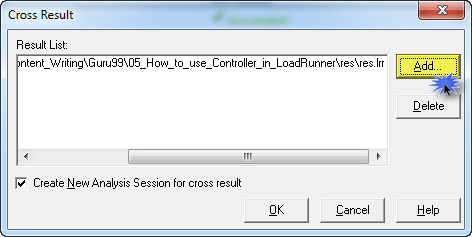
The Result List is showing your current results folder (for which the analysis is being performed)
You can click on the Add button to add another result folder with which a cross will be analyzed.
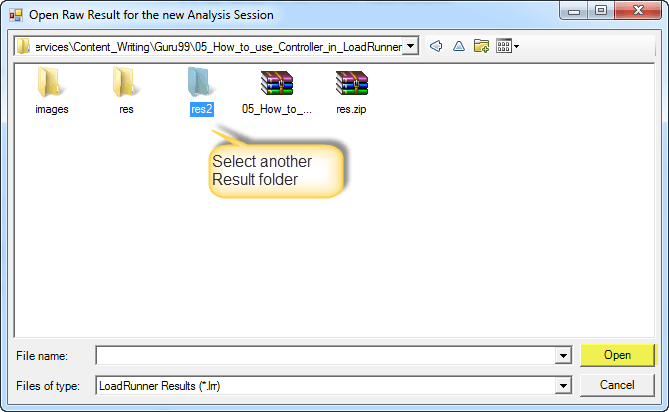
Select the other result folder and click on Open.
The previous Results List window will be open again. This time you will have two result folders in the list.
Have a look at the window:
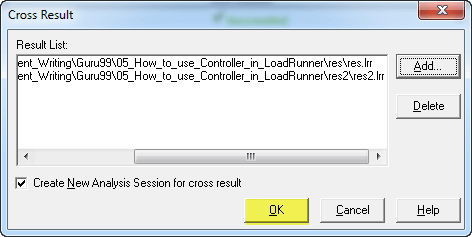
Click on the OK button.
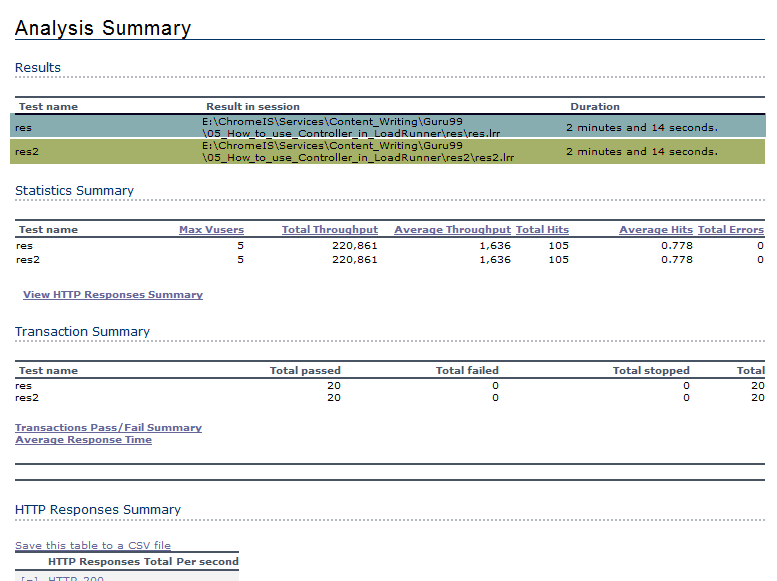
A new window will open containing side by side comparison of both results.
Here is a snapshot:
You can add as many result folder in the cross list as you wish, however, this will become complicated to understand and analyse. So it is suggested to keep the list short.
7. Saving a Session
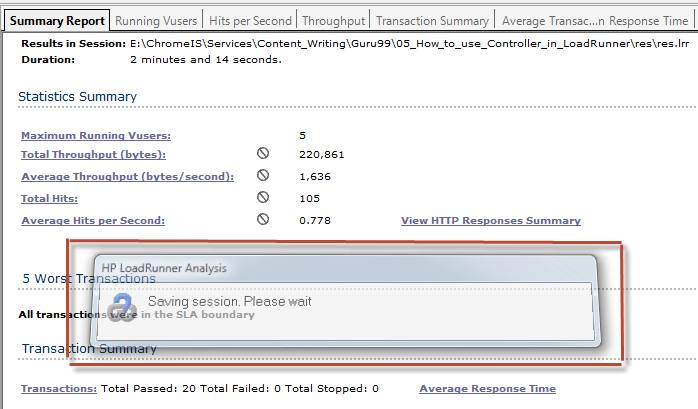
Working with HP Analysis may take significant time. Since you may have merged graph or currently studying some new graph, it is a good idea to keep your session information saved.
To save your session, click on the File Menu and click on Save.
Below dialogue window will open:
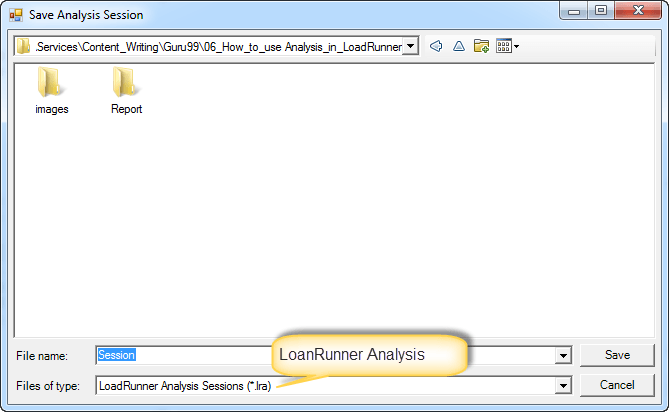
Clicking the Save button will initiate the Save process which could be instant or time consuming, depending on the size of session.
Here is what the window looks like:
7.1 Opening a Session
You can open an existing session in similar way. Simply click Open under File Menu and select the folder of saved session. Remember, HP Analysis will not open the last folder node; rather it will open the folder itself.
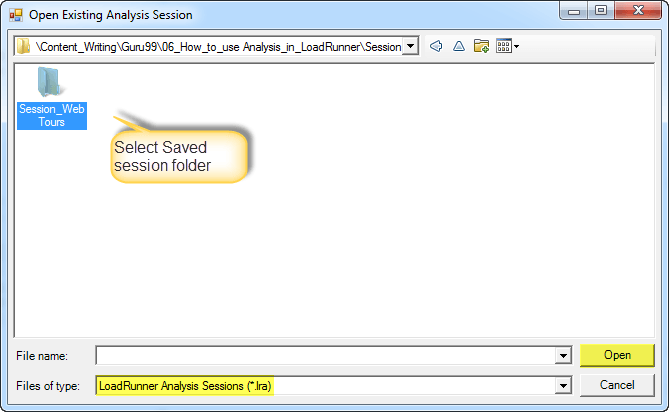
This will open the main window of Analysis where you can resume your work.
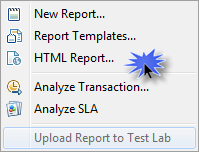
8. Exporting into HTML Report:
HP Analysis provides a feature to export all data into a well formatted HTML or doc format report. To export, click on the Report menu and select HTML Report. Have a look at the menu below:
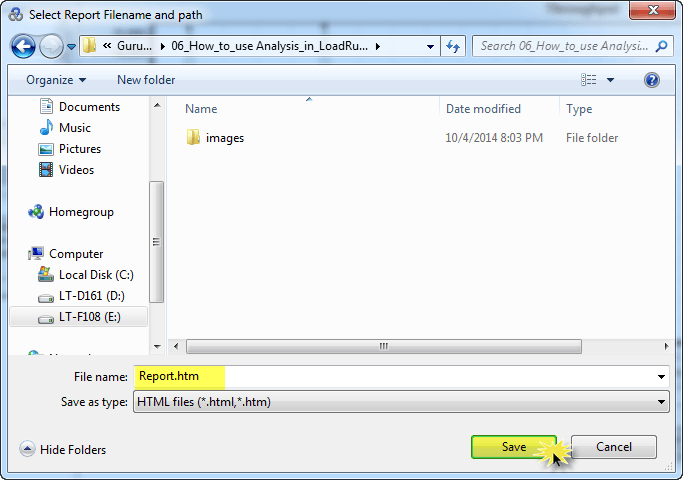
This will open a dialogue box to locate the directory where HML report will be placed.
Have a look at the screen snapshot below:
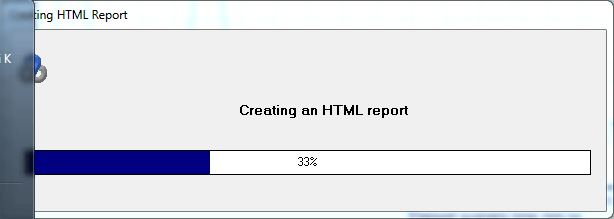
As soon as you click the Save button, HP Analysis will start exporting results and preparing a report in HTML format. A splash screen will appear for a short period, depending upon the size of report you’re exporting:
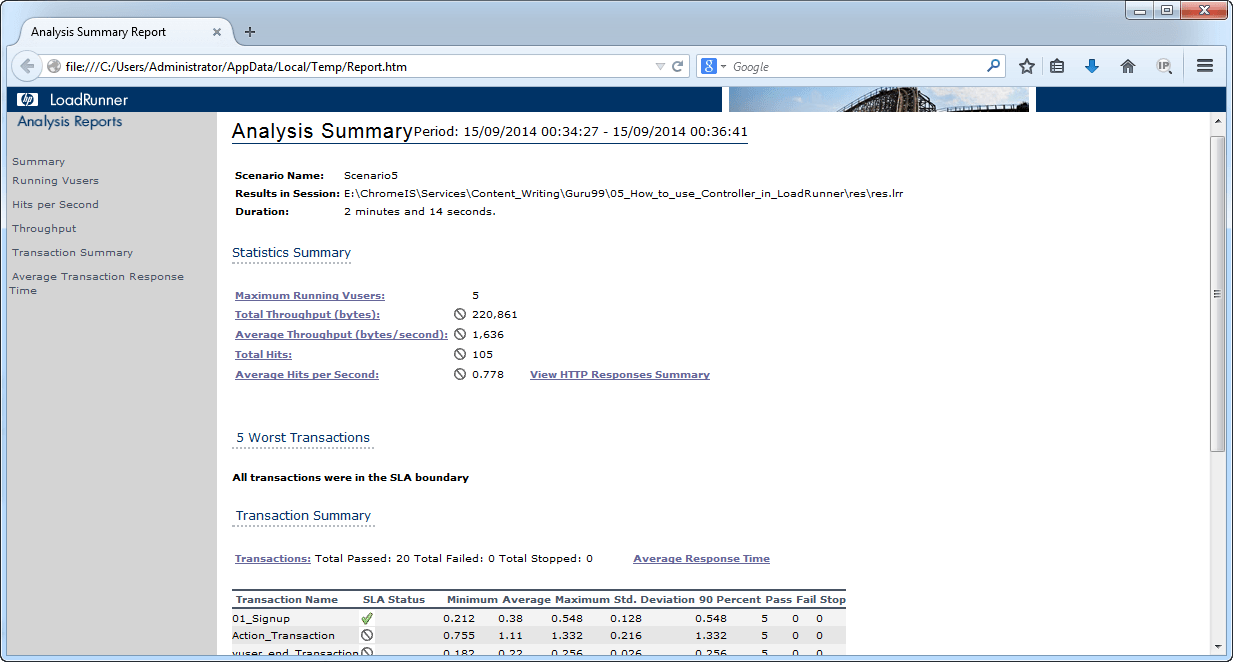
After the export finishes, it will immediately open the recently exported HTML file in Internet Explorer or your default browser. Here it how your 1st Performance Testing Report looks like:


Comments
Post a Comment