JMeter, Docker, Grafana Integration
JMeter Docker
Installation

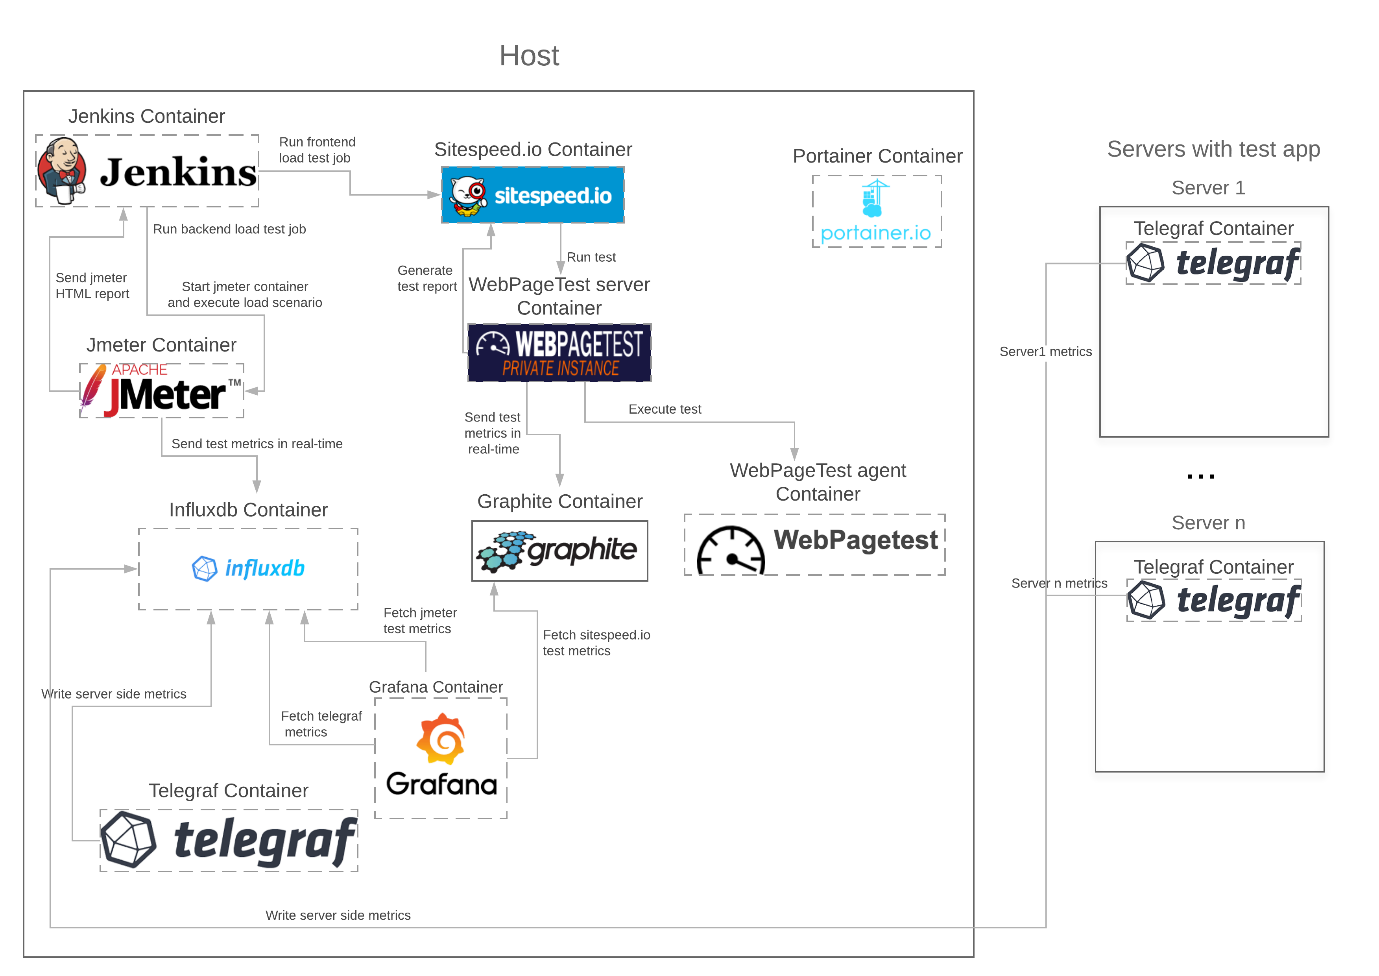
Performance Testing Framework on Docker
This framework could be used both for backend load testing with Apache JMeter and frontend load test with sitespeed.io + webpage test private instance.
Custom Grafana dashboards features:
view application/server-side metrics in real time while test is running
analyze errors cause with detailed traces for failed requests
compare different test runs in scripted dashboard
Dashboard demo
Tests comparison
Getting Started
Framework consists of next services:
Grafana: data visualization & monitoring
Influxdb: time series DB platform for metrics & events (Time Series Data)
Telegraf: server agent for collecting & reporting metrics
Sitespeed.io: set of tools for frontend load testing
Graphite: time series DB platform for metrics
Jenkins: continuous integration server for tests execution
Portainer: service for managing docker environment
Webpagetest: private instance of webpagetest server for frontend tests execution
Apache Jmeter: tool for backend load testing
Framework architecture:
Prerequisites
Install Git Desktop
Install Git Bash
Install Docker Desktop
Download kubectl and set the path in Env variables
Installation Process
Clone this repository git clone https://github.com/serputko/performance-testing-framework.git
open performance-testing-framework dir
For Backend testing:
(optional) if you want to update existing services
docker-compose pull
docker-compose build
docker-compose down
docker-compose up -d
For Frontend + Backend testing
(optional) if you want to update existing services
docker-compose -f docker-compose-with-frontend.yml pull
docker-compose -f docker-compose-with-frontend.yml build
docker-compose -f docker-compose-with-frontend.yml down
docker-compose -f docker-compose-with-frontend.yml up -d
All containers should be up and running
Services endpoints
jenkins localhost:8181
grafana localhost:8857
portainer localhost:9000
webpagetest server localhost:80
influxdb localhost:8653
Jenkins
Login to Jenkins with admin/admin(could be changed in docker-compose file) By default jenkins consists of 2 jobs:
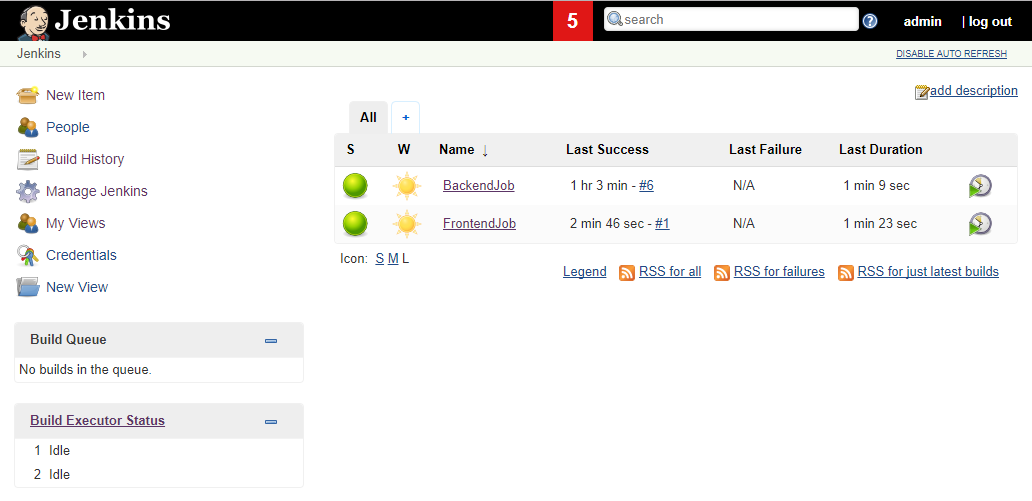
BackendJob: run Jmeter scenarios
FrontendJob: run tests with sitespeed.io and webpagetest private instance
Running demo JMeter scenario with Backend Job
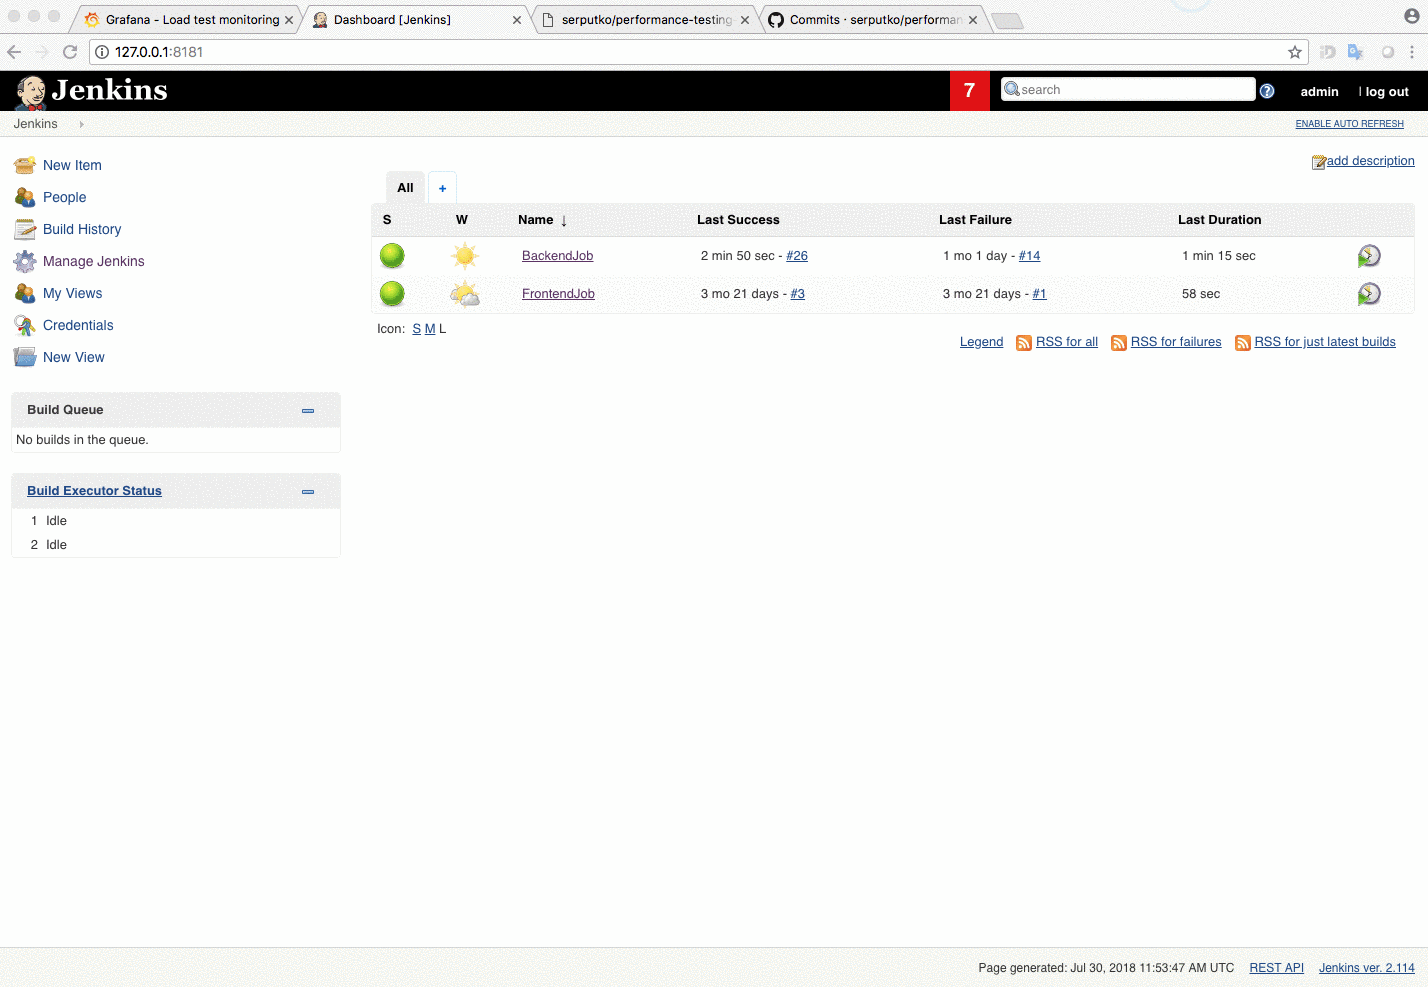
To run jmeter demo script: Open BackendJob -> Build with Parameters -> Set build parameters -> Select scenario -> Build
This job will start jmeter docker container and execute demo_scenario.jmx jmeter scenario
To open demo scenario in local instance of JMeter please install Plugin Manager https://jmeter-plugins.org/wiki/PluginsManager/. It will automatically install all required plugins.
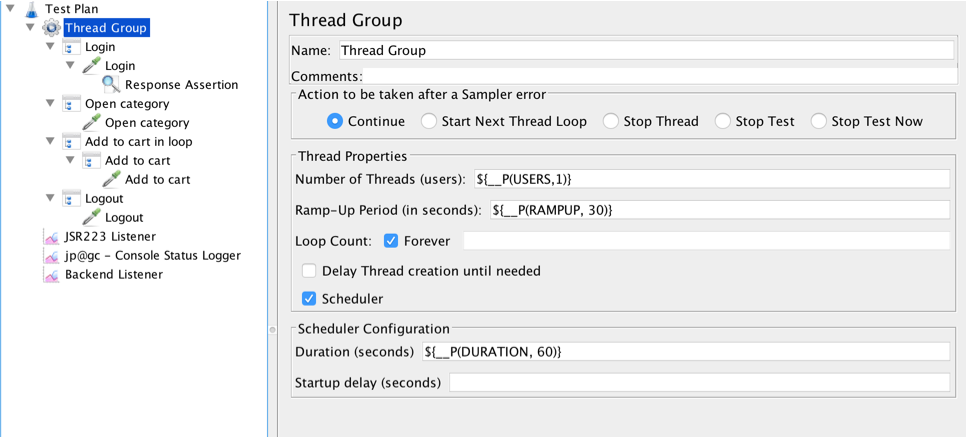
Making your JMeter script compatible with framework
Create JMeter test scenario
Modify your JMeter scenario to work with framework, add:
JSR223 Listener from demo scenario Contains groovy script that:
Generates detailed trace about request/response info for failed samplers
Posts generated trace to JMeter log(could be viewed in Jenkins job)
Set trace to sampler response message. If failed samplers are part of Transaction Controller (generate parent sample enabled) all traces will be set to Transaction Controller response message
Backend Listener from demo scenario Sends samplers data to influx dB database. Fields:
application - groovy script set field value in next format:
.jmx file title @ Jenkins build number @ test start time (f.e. demo_scenario.jmx @ 18 @ Sat Jul 28 09:44:26 UTC 2018)
test Title - groovy script generates parameterized title like:
Jenkins build #18 http://127.0.0.1:8181/job/BackendJob/18/ with demo_scenario.jmx scenario with 10 users, 180 sec ramp up and 600 sec duration was started
event Tags - info from test Title field in tag format
Data from these fields will be displayed in Grafana dashboard annotations- Green/Red vertical lines that stands for test Start/End.
(optional) jp@gc - Console Status Logger sends minimalistic stats to jenkins console output about test execution:
#43 Threads: 3/10 Samples: 16 Latency: 23 Resp.Time: 197 Errors: 2
#44 Threads: 3/10 Samples: 16 Latency: 32 Resp.Time: 203 Errors: 1
Grafana
Start demo_scenario.jmx test with Jenkins Backend job
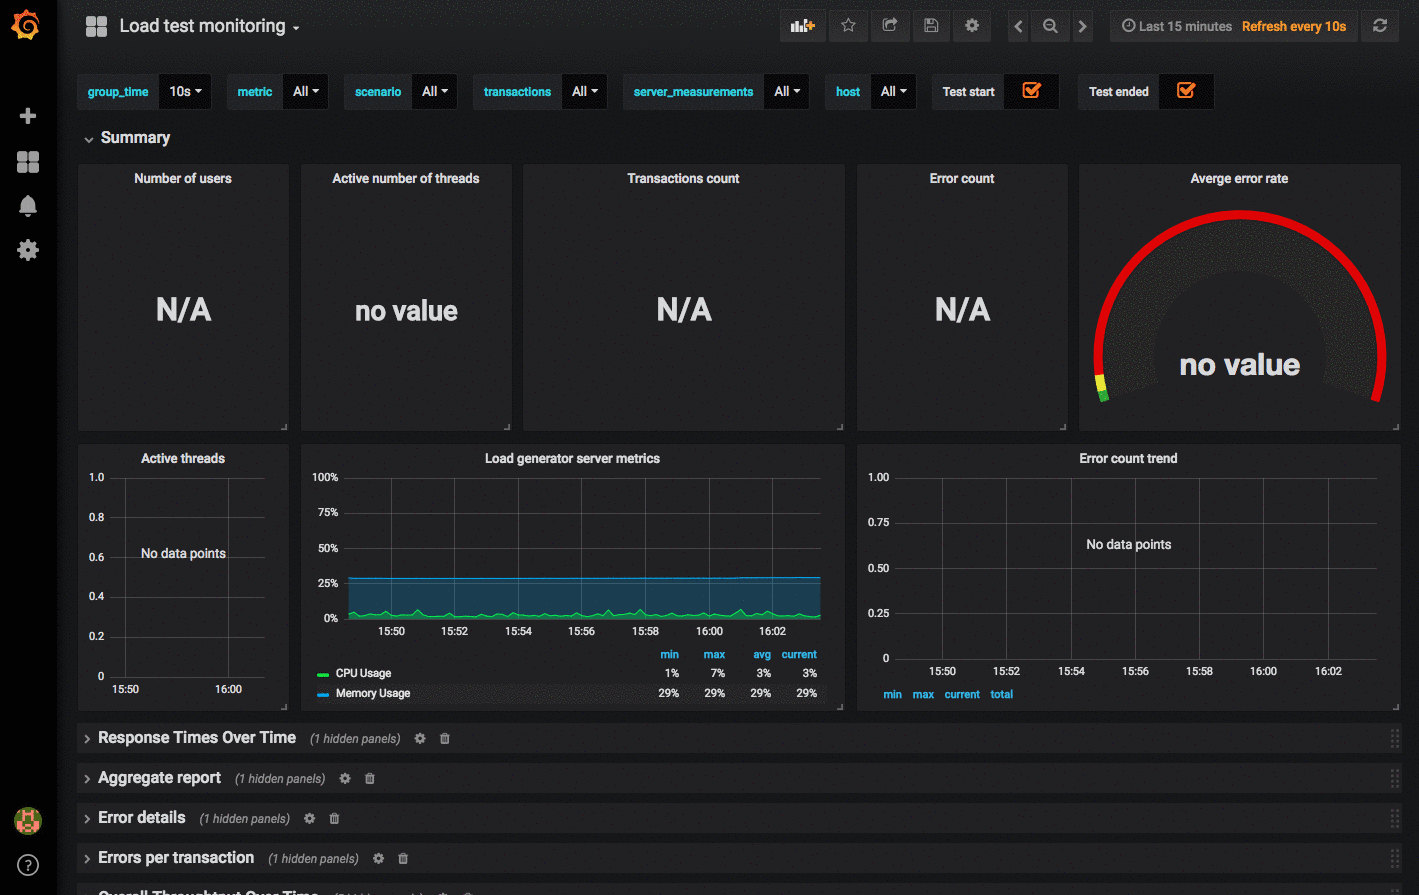
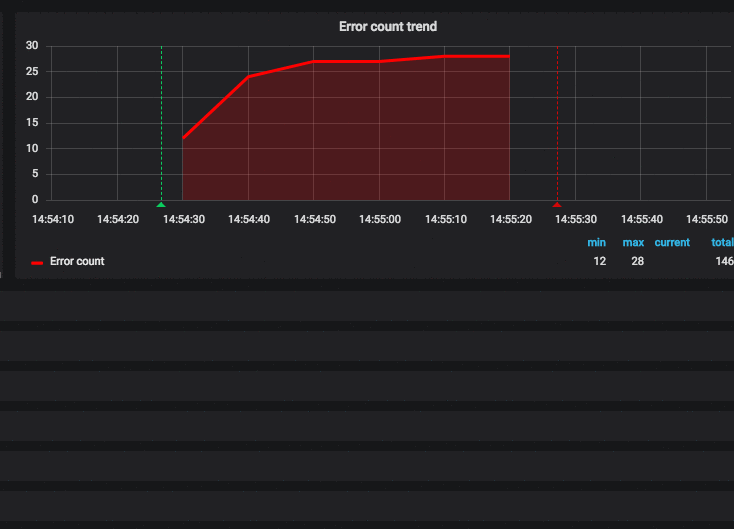
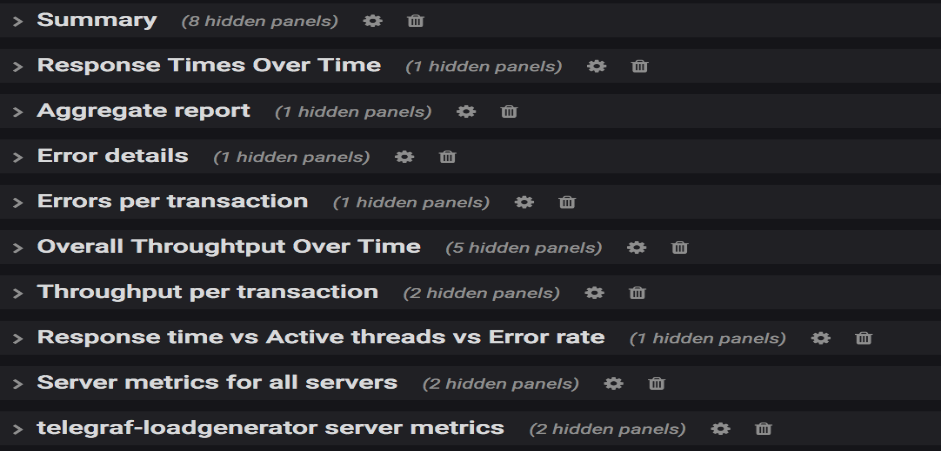
Real time results should be available in Grafana Open 'Load test monitoring' dashboard. Dashboard contains visualizations based on data from influx dB.
Available metrics
Dashboard has multiple rows with different metrics
Timerange
All values in visualizations are calculated according to selected time range. Default time range is last 15 min with 10 sec refresh.
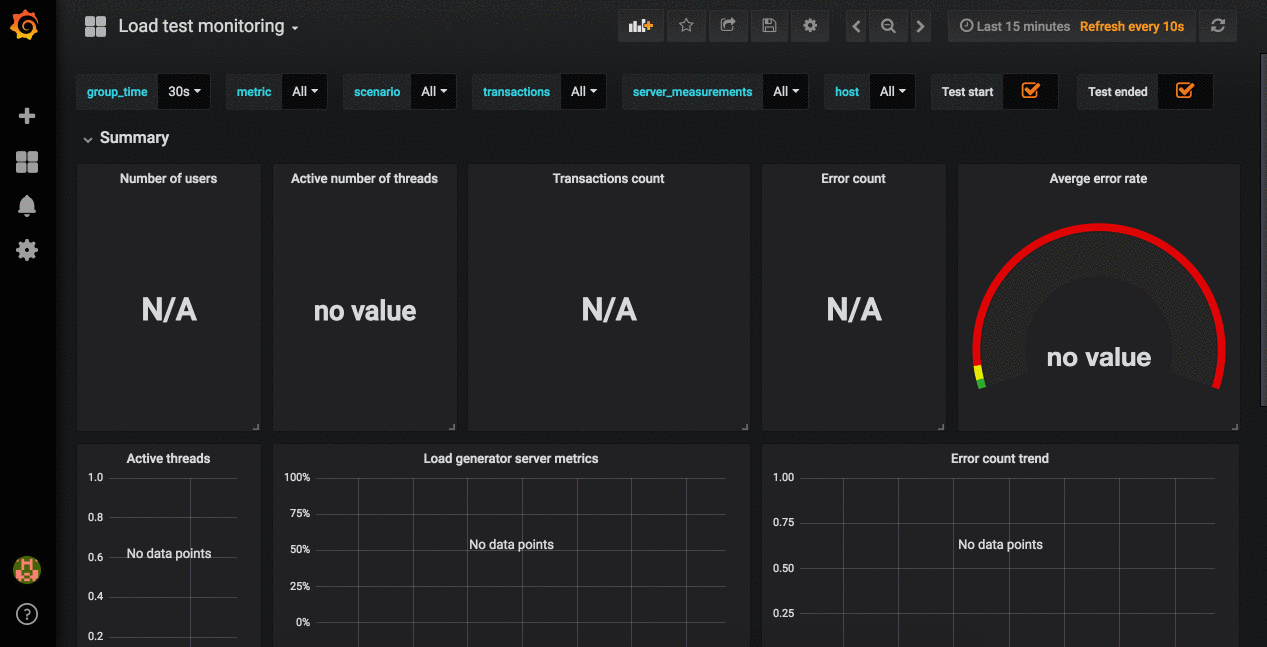
Templating
Graphs and series on dashboard are displayed dynamically according to variables selected
group_time - aggregation time
metric - which series to show on Response Times Over Time graph(default All)
scenario - results of which scenario to display
transactions - which transactions to show on Response Times Over Time row(default All). transaction variable depends on scenario variable
server_measurements - which server side metrics to show
host - for which servers show monitoring
Failed requests details
If JSR223 listener was added to scenario than detailed traces for failed requests can be viewed in 'Error details' table. Example of failed request:
Number of samples in transaction : 1, number of failing samples : 1
Login; Response message: Unauthorized;
Status code: 401;
Number of failed assertions: 1
Sample Failed: Login
Started at: Mon Jul 30 11:54:59 UTC 2018
Finished at: Mon Jul 30 11:54:59 UTC 2018
Request:
{
"code": "1234567"
}
REQUEST DATA
URL: http://demo-server.com/login
Request headers:
Content-Type: application/json
Response:
Unauthorized
Response code:401
Response data:
{
"Error message": "Incorrect password or confirmation code entered. Please try again."
}
Assertion results:
Number of failed assertions: 1
Response Assertion Failed;
Failure Message: Test failed: text expected to contain /success/;
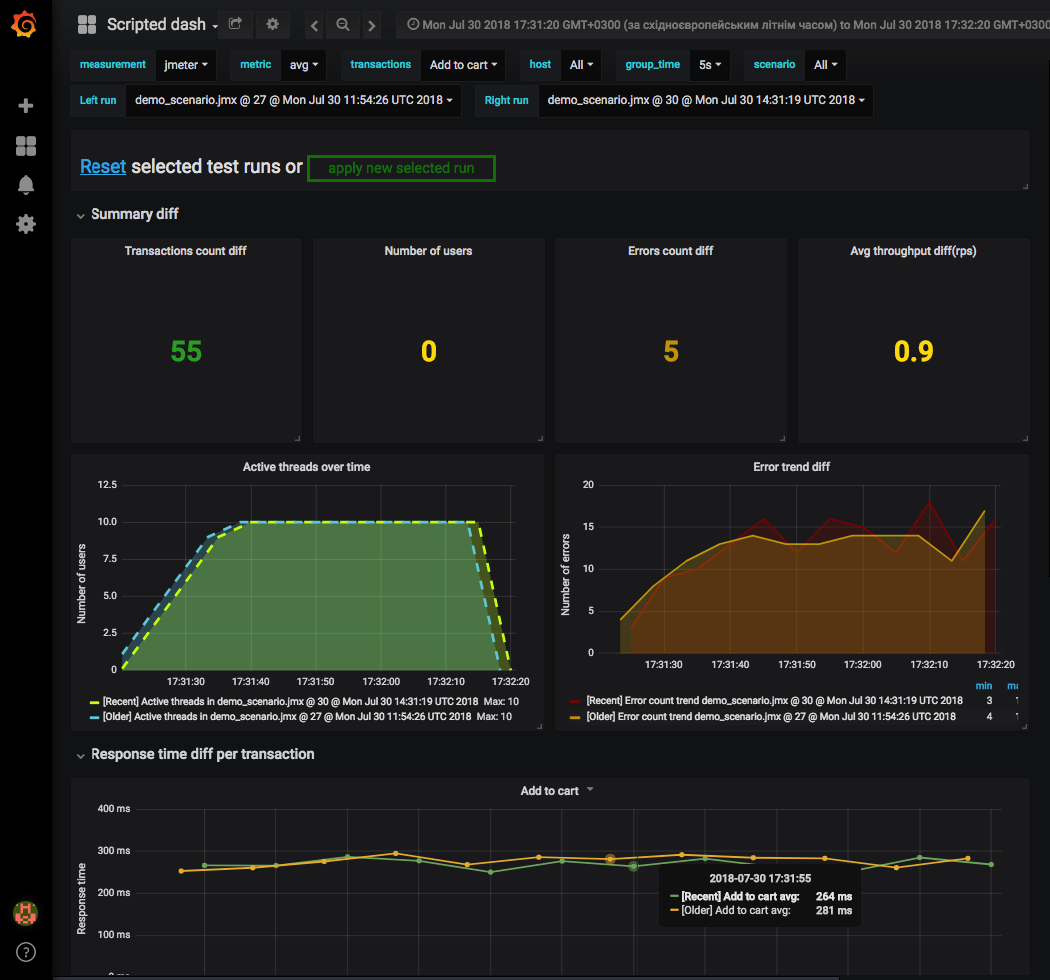
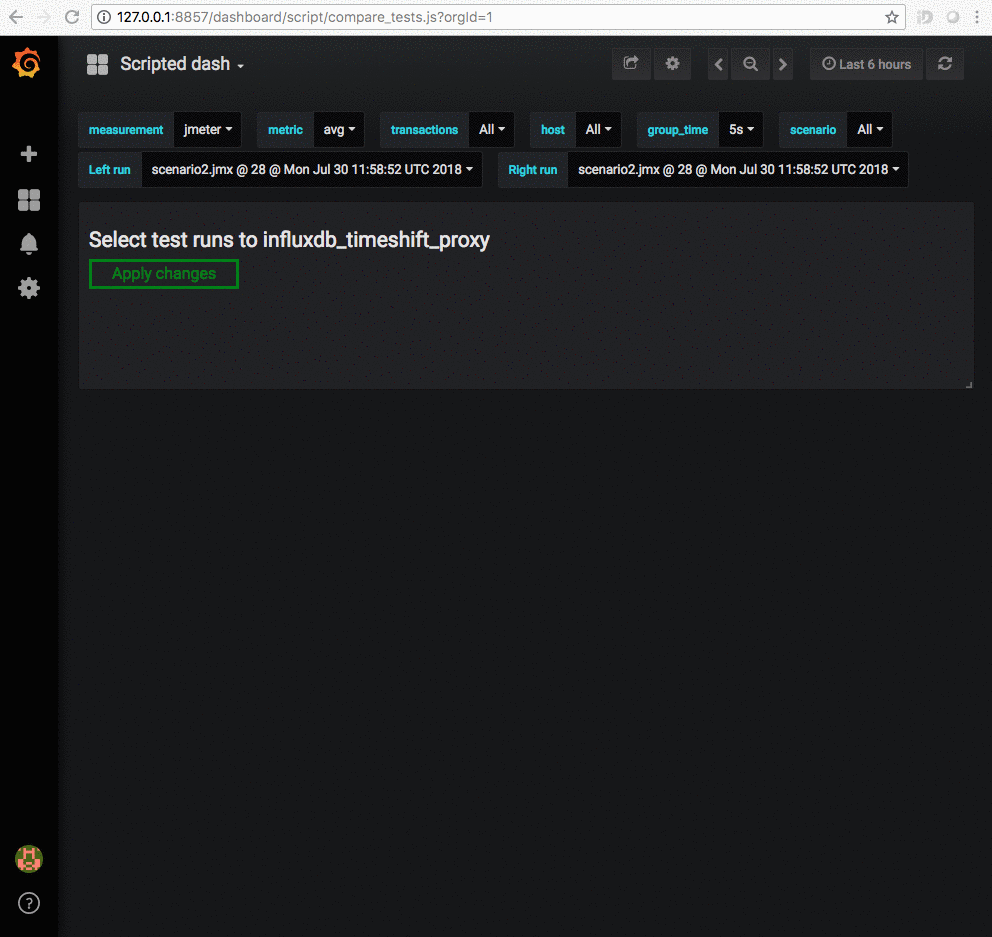
Test runs comparison
Tests comparison is done using scripted js dashboard. It could be accessed at http://127.0.0.1:8857/dashboard/script/compare_tests.js
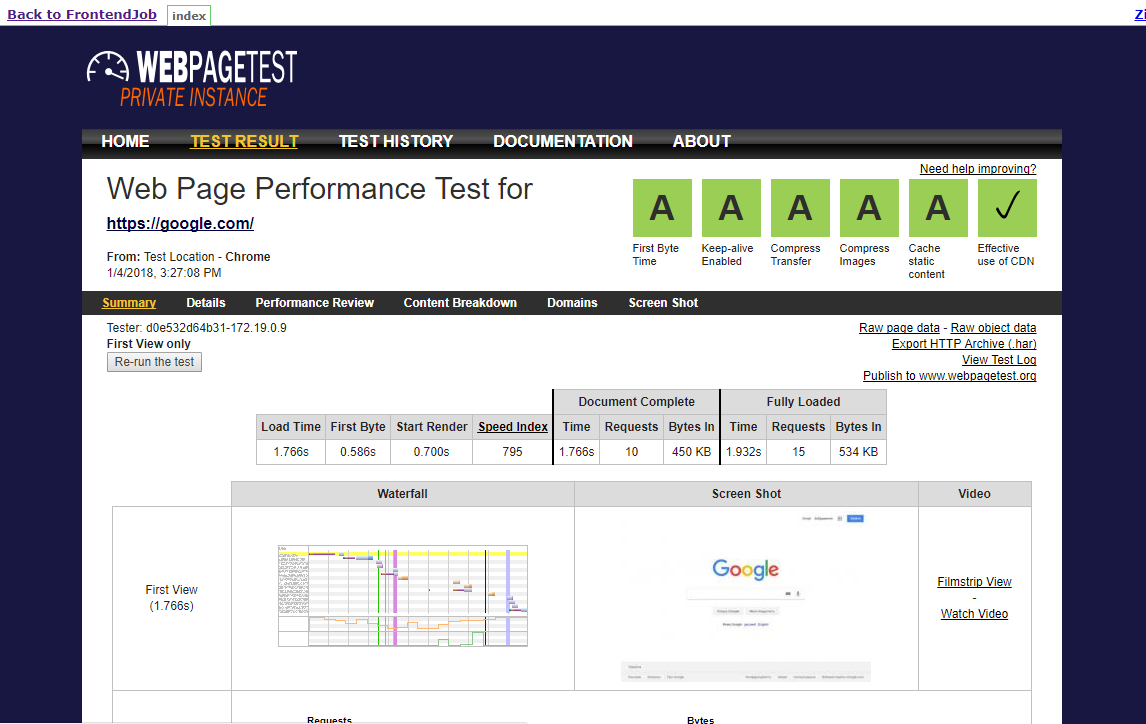
FrontendJob
To run frontend test: Open FrontendJob -> Build with Parameters -> Set build parameters -> Build
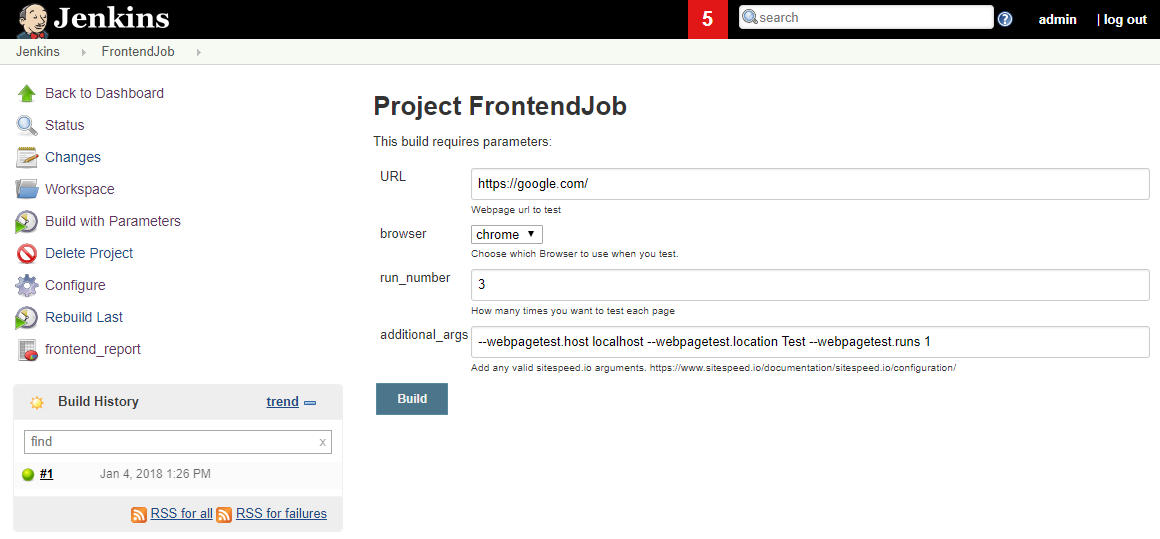
This job will start sitespeed.io docker container and run test with parameters using WebPageTest private instance
Frontend test deliverables:
sitespeed.io HTML report
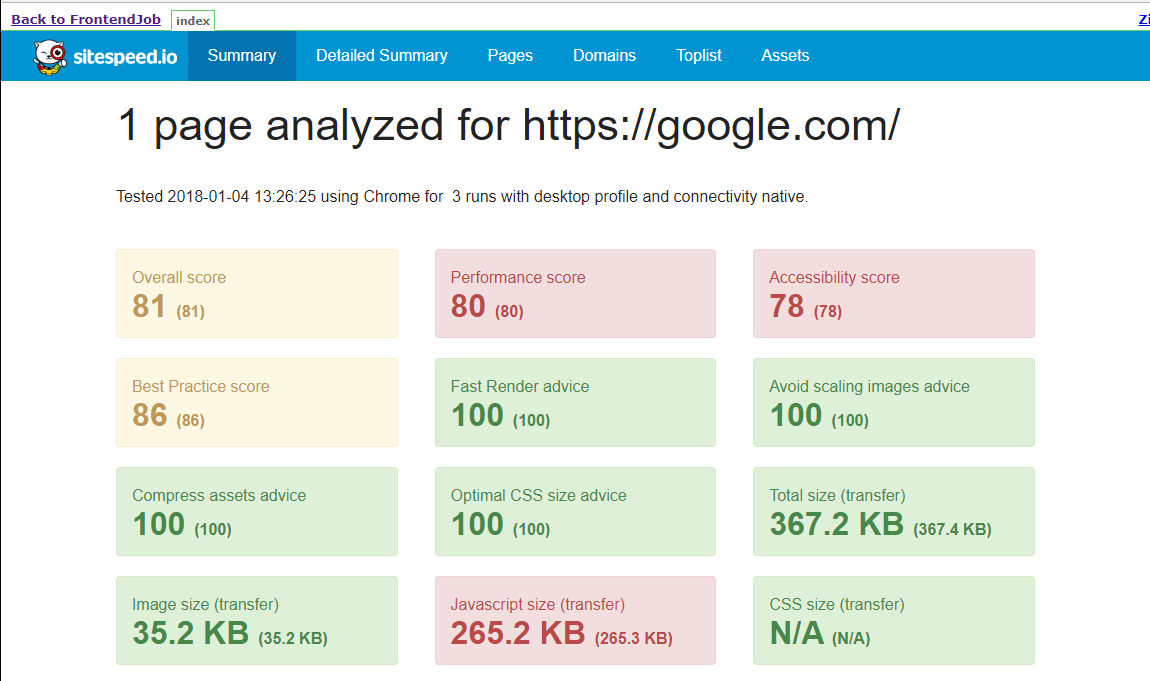
Web Page Test HTML Report
Refer: https://github.com/serputko/performance-testing-framework


Comments
Post a Comment