JMeter, Grafana, InfluxDb Integration
JMeter, Grafana, InfluxDb Integration
JMeter is an Open
Source testing software. It is 100% pure Java application for load and
performance testing. Jmeter is designed to cover categories of tests like load,
functional, performance, regression, etc.
Jmeter Features
·
It has a simple
and intuitive GUI.
·
JMeter can conduct
load and performance test for many different server types: Web - HTTP, HTTPS,
SOAP, Database via JDBC, LDAP, JMS, Mail - POP3, etc.
· It is a platform-independent tool.
On Linux/Unix, JMeter can be invoked by clicking on JMeter shell script. On
Windows, it can be invoked by starting the jmeter.bat file.
JMeter stores its test plans in XML format. It means you
can generate a test plan using a text
editor.
How JMeter Works?
JMeter simulates a group of users sending requests to a
target server, and returns statistics that show the performance/functionality
of the target server/application via tables, graphs, etc.
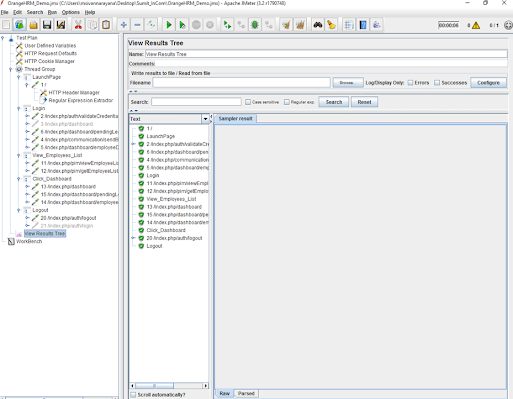
Jmeter DashBoard:
Backend Listner in Jmeter:
To make Jmeter send metrics
to backend add a BackendListner using the Graphite BackendListner Client.

If you run the any test from your Jmeter, the backend
listner will autometically send metrics to your InfluxDb.
What is InfluxDB : InfluxDB
is an open-source time series
database developed by InfluxData. It is written in Go and optimized for fast,
high-availability storage and retrieval of time series data in fields such as
operations monitoring, application metrics, Internet of Things sensor data, and real-time
analytics. It also has support for processing data from Graphite.
Open localhost:8083 on your browser After that InfluxDb seems
like.

Installation:
·
Download and install “Github”
·
Download and install “Go” Programming
language installer.
·
Download and install “Tortoisehg”
·
Run command line mode below
InfluxDB database configuration
Connect to InfluxDB using influx shell and create two databases:
·
grafana : Used by Grafana
to store the dashboards we will create
·
jmeter : Used by InfluxDB
to store the data sent to Graphite Listener as per database="jmeter"
config element in influxdb.conf
Before starting influxDb we need to configure settings on
influxdb.conf file..Change the database name as per your requirment.Here my
database name is ProkarmaDemo and my database ip is localhost:8083 .After
changing configuration file save it and start the influx sever.
After starting the server it seems like:

If you want to create your own database then create database
on InfluxDb database, you can use this database name to your grafana.

Grafana will take all the metrics from this database as you
mentioned.
GRAFANA
What is Grafana : Grafana is an open source metric analytics & visualization
suite. It is most commonly used for visualizing time series data for
infrastructure and application analytics but many use it in other domains
including industrial sensors, home automation, weather, and process control.
Installation
Grafana is a frontend for Graphite,
InfluxDB and
OpenTSDB with
powerfull visualization features for time series data. You will need either a
Graphite, InfluxDB or OpenTSDB server for Grafana to be of any use.
Download
Download the latest release. The release package
contain a subfolder, for example grafana-1.7.0. The contents of this folder
should be hosted by a web server, for example nginx, apache, IIS. The standard
release packages does not contain a web server to host Grafana.
Dependencies
There
are no dependencies, Grafana is a client side application that runs in your
browser. It only needs a time series store where it can fetch metrics. If you
use InfluxDB Grafana can use it to store dashboards. If you use Graphite or
OpenTSDB you can use Elasticsearch to store dashboards or just use json files
stored on disk.
Configuration
In
your chosen Grafana install location, locate the file config.sample.js and copy
or rename it to config.js. This files contains global settings for your Grafana
installation.
Datasources
The
datasources property defines your metric, annotation and dashboard storage
backends.
·
You can specify multiple datasources.
·
default: true marks it as the default
metric source (if you have multiple)
·
grafanaDB: true marks it for use as
dashboard storage (applicable for InfluxDB & Elasticsearch)
How to Configure Jmeter and Grafana
· a GraphiteBackendListenerClient which allows you to send metrics
to a Graphite Backend.
This feature provides:
·
Live results
·
Nice graphs for metrics
·
Ability to compare 2 or
more load tests
·
Storing monitoring data as
long as JMeter results in the same backend
·
an
InfluxDBBackendListenerClient introduced in JMeter 3.2 which allows you to send
metrics to an InfluxDB Backend using UDP or HTTP protocols This feature
provides:
·
Live results
·
Nice graphs for metrics
·
Ability to compare 2 or
more load tests
·
Ability to add annotations
to graphs
·
Storing monitoring data as
long as JMeter results in the same backend
In this
document we will present the configuration setup to graph and historize the
data in different backends:
·
InfluxDB setup for
InfluxDBBackendListenerClient
·
InfluxDB setup for
GraphiteBackendListenerClient
·
Grafana
·
Graphite
Here we
can configure the Grafana configurations using our Grafana conf custom file.

After complete the configuration open
localhost:9494 on your browser as you given your port number on your custom
file.After that you can see the dash board.

Enter username ''amdin''
Enter password ''admin''
After logging you can see the Grafana dashboard

After that we have to create one database for collecting metrics.We should use your InfluxDb database name as your Grafana database name.After connecting InfluxDb database we can see here.

After that go to
dashboard and create new dashboard and and click graphs templates whatever you want.After that add grafana codes
for metrics.Here I prepared graphs for basic
metrics.Here you can prepare the graphs in your own styles.
 |
After preparing the graphs you can see
graphs before running the test.

How to use Grafana :
Let’s start with creating a new Dashboard.
You can find the new Dashboard link on the right side of the Dashboard picker.
You now have a blank Dashboard.

Dashboards, Panels, Rows, the building
blocks of Grafana
Dashboards are at the core of what Grafana is all about.
Dashboards are composed of individual Panels arranged on a number of Rows.
Grafana ships with a variety of Panels. Grafana makes it easy to construct the
right queries, and customize the display properties so that you can create the
perfect Dashboard for your need. Each Panel can interact with data from any
configured Grafana Data Source (currently InfluxDB, Graphite, OpenTSDB,
Prometheus and Cloudwatch). The Basic Concepts guide explores these key ideas
in detail.

Adding & Editing
Graphs and Panels

Drag-and-Drop panels
You can Drag-and-Drop Panels within and
between Rows. Click and hold the Panel title, and drag it to its new location.
You can also easily resize panels by clicking the (-) and (+) icons.

We can
use these codes for metrics collection.
Thread/Virtual
Users metrics
Thread metrics are the
following:
<rootMetricsPrefix>test.minAT
Min active threads
<rootMetricsPrefix>test.maxAT
Max active threads
<rootMetricsPrefix>test.meanAT
Mean active threads
<rootMetricsPrefix>test.startedT
Started threads
<rootMetricsPrefix>test.endedT
Finished threads
Response times metrics
Response related metrics
are the following:
<rootMetricsPrefix><samplerName>.ok.count
Number of successful responses for sampler name
<rootMetricsPrefix><samplerName>.h.count
Server hits per seconds, this metric cumulates
Sample Result and Sub results (if using Transaction Controller, "Generate
parent sampler" should be unchecked)
<rootMetricsPrefix><samplerName>.ok.min
Min response time for successful responses of
sampler name
<rootMetricsPrefix><samplerName>.ok.max
Max response time for successful responses of
sampler name
<rootMetricsPrefix><samplerName>.ok.avg
Average response time for successful responses
of sampler name.
<rootMetricsPrefix><samplerName>.ok.pct<percentileValue>
Percentile computed for successful responses of
sampler name. There will be one metric for each calculated value.
<rootMetricsPrefix><samplerName>.ko.count
Number of failed responses for sampler name
<rootMetricsPrefix><samplerName>.ko.min
Min response time for failed responses of
sampler name
<rootMetricsPrefix><samplerName>.ko.max
Max response time for failed responses of
sampler name
<rootMetricsPrefix><samplerName>.ko.avg
Average response time for failed responses of
sampler name.
<rootMetricsPrefix><samplerName>.ko.pct<percentileValue>
Percentile computed for failed responses of
sampler name. There will be one metric for each calculated value.
<rootMetricsPrefix><samplerName>.a.count
Number of responses for sampler name (sum of
ok.count and ko.count)
<rootMetricsPrefix><samplerName>.a.min
Min response time for responses of sampler name
(min of ok.count and ko.count)
<rootMetricsPrefix><samplerName>.a.max
Max response time for responses of sampler name
(max of ok.count and ko.count)
<rootMetricsPrefix><samplerName>.a.avg
Average response time for responses of sampler
name (avg of ok.count and ko.count)
<rootMetricsPrefix><samplerName>.a.pct<percentileValue>
Percentile computed for responses of sampler
name. There will be one metric for each calculated value. (calculated on the
totals for OK and failed samples)
The
default percentiles setting on the Backend
Listener is "90;95;99", i.e. the 3 percentiles
90%, 95% and 99%.
The Graphite
naming hierarchy uses dot (".") to separate elements.
This could be confused with decimal percentile values. JMeter converts any such
values, replacing dot (".") with underscore ("-"). For
example, "99.9" becomes "99_9"
By
default JMeter sends metrics for all samplers accumulated under the samplerName
"all". If the Backend Listener samplersList is
configured, then JMeter also sends the metrics for the matching sample names
unless summaryOnly=true


Comments
Post a Comment