JMeter Tutorial
JMeter Tutorial

JMeter - Test Plan Elements:
A Test Plan comprises of at least one Thread Group. Within each Thread Group, we may place a combination of one or more of other elements − Sampler, Logic Controller, Configuration Element, Listener, and Timer. Each Sampler can be preceded by one or more Pre-processor element, followed by Post-processor element, and/or Assertion element. Let us see each of these elements in detail
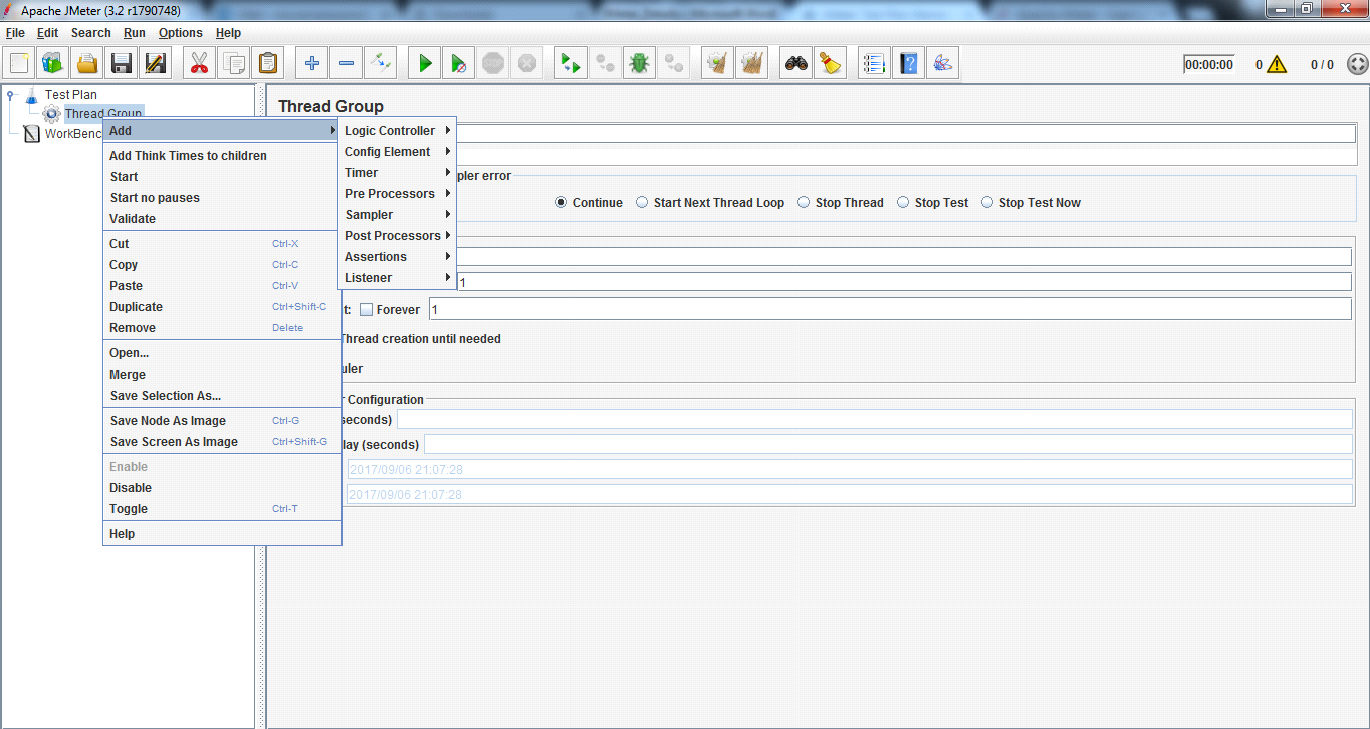
Thread Group: Thread Group elements are the beginning points of your test plan. As the name suggests, the thread group elements control the number of threads JMeter will use during the test. We can also control the following via the Thread Group −
Setting the number of threads
Setting the ramp-up time
Setting the number of test iterations
Thread Group Control Panel looks like this. The Thread Group Panel holds the following components −
Action to be taken after a Sampler error − In case any error occurs during test execution, you may let the test either −
Continue to the next element in the test
Stop Thread to stop the current Thread.
Stop Test completely, in case you want to inspect the error before it continues running.
Number of Threads − Simulates the number of users or connections to your server application.
Ramp-Up Period Defines how long it will take JMeter to get all threads running.
Loop Count − Defines the number of times to execute the test.
Scheduler checkbox − Once selected, the Scheduler Configuration section appears at the bottom of the control panel.
Scheduler Configuration − You can configure the start and end time of running the test.

Controllers:
JMeter has two types of Controllers − Samplers and Logic Controllers.
Samplers
Samplers allow JMeter to send specific types of requests to a server. They simulate a user request for a page from the target server. For example, you can add a HTTP Request sampler if you need to perform a POST, GET, or DELETE on a HTTP service.
Some useful samplers are −
HTTP Request
FTP Request
JDBC Request
Java Request
SOAP/XML Request

Logic Controllers:
Logic Controllers let you control the order of processing of Samplers in a Thread. Logic controllers can change the order of a request coming from any of their child elements. Some examples are − ForEach Controller, While Controller, Loop Controller, IF Controller, Run Time Controller, Interleave Controller, Throughput Controller, and Run Once Controller.
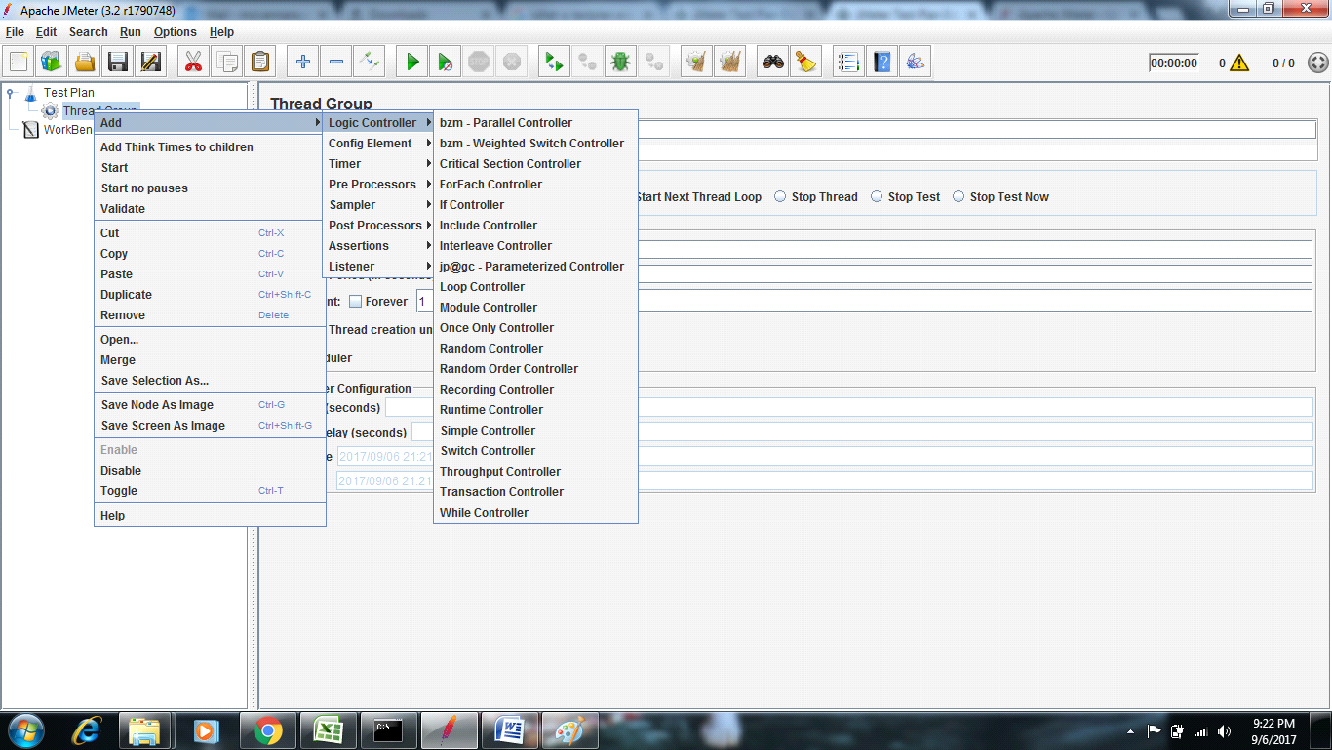
The following list consists of all the Logic Controllers JMeter provides −
Simple Controller
Loop Controller
Once Only Controller
Random Controller
Random Order Controller
Throughput Controller
If Controller
While Controller
Switch Controller
ForEach Controller
Transaction Controller
Recording Controller
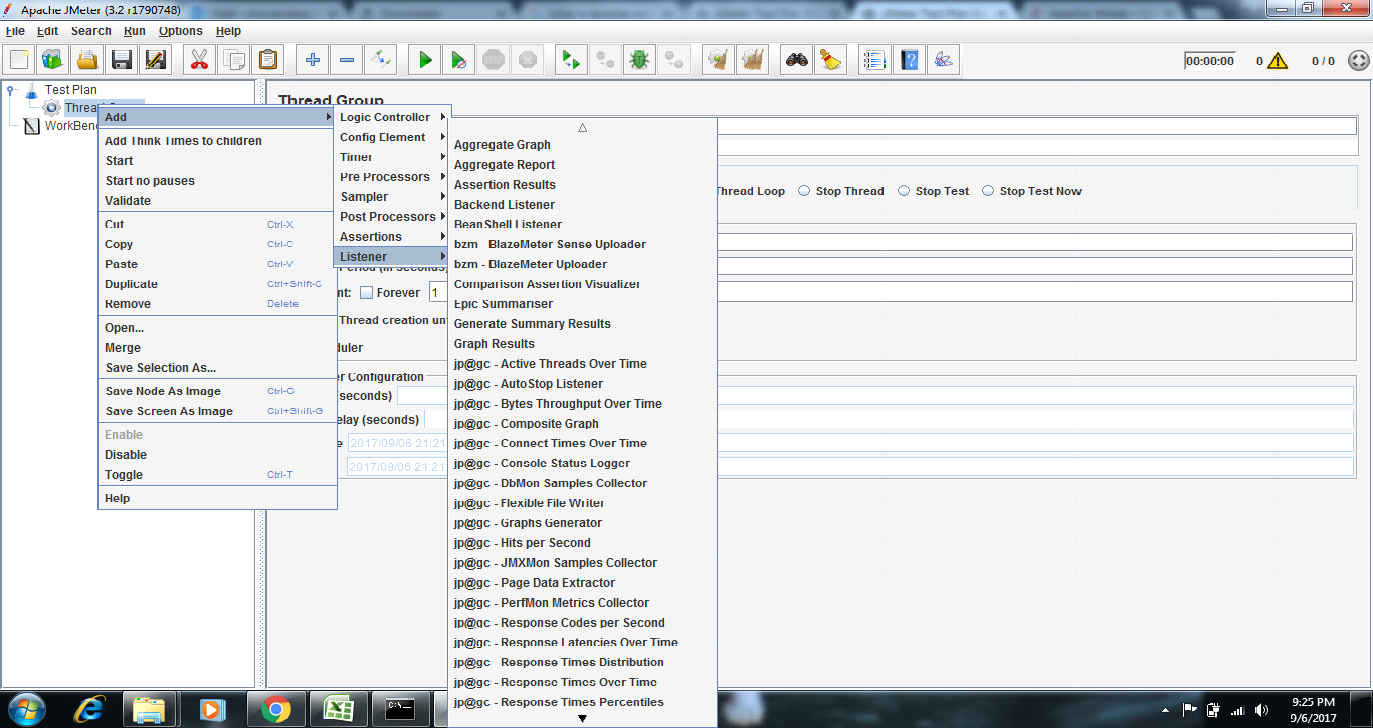
Listeners:
Listeners let you view the results of Samplers in the form of tables, graphs, trees, or simple text in some log files. They provide visual access to the data gathered by JMeter about the test cases as a Sampler component of JMeter is executed.
Listeners can be added anywhere in the test, including directly under the test plan. They will collect data only from elements at or below their level. The following list consists of all the Listeners JMeter provides
Sample Result Save Configuration
Graph Full Results
View Results Tree
Aggregate Report
View Results in Table
Aggregate Graph
Summary Report
Backend Listner
Timers:
By default, a JMeter thread sends requests without pausing between each sampler. This may not be what you want. You can add a timer element which allows you to define a period to wait between each request.
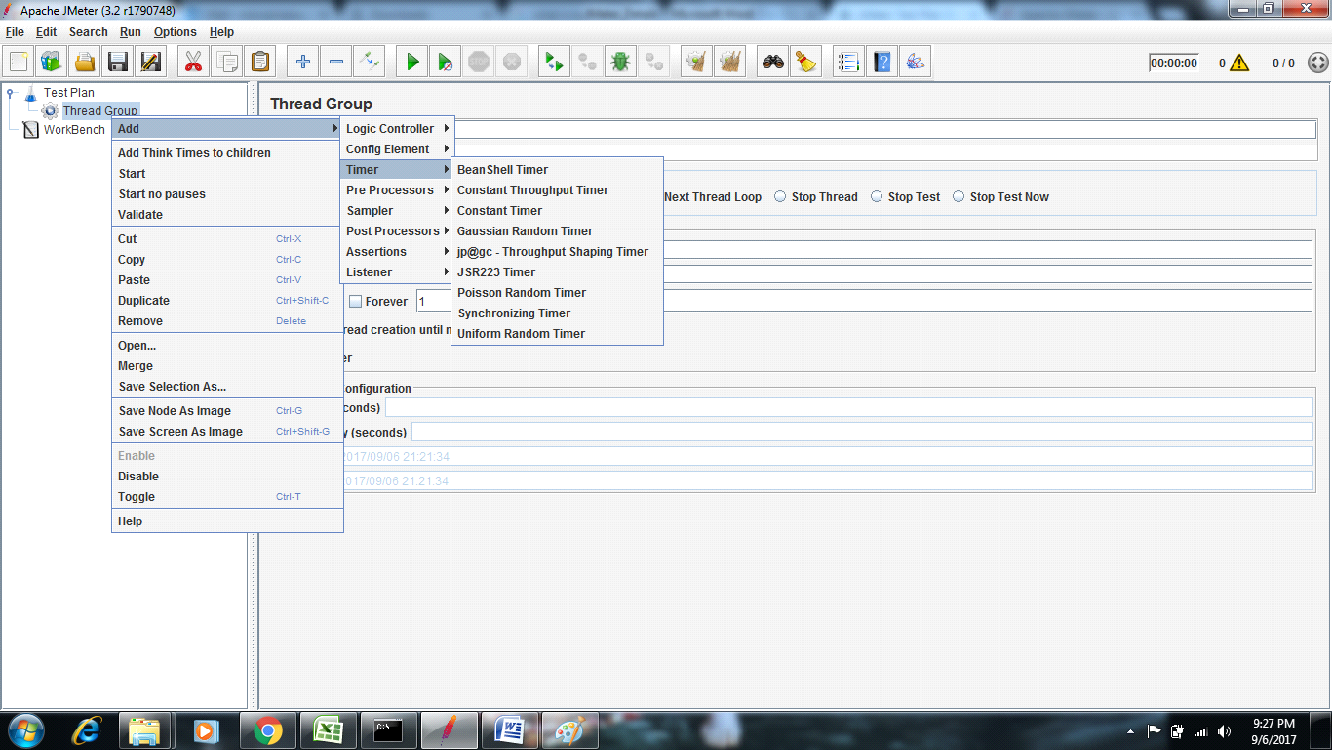
The following list shows all the timers that JMeter provides −
Constant Timer
Gaussian Random Timer
Uniform Random Timer
Constant Throughput Timer
Poisson Random Time
Assertions:
Assertions allow you to include some validation test on the response of your request made using a Sampler. Using assertions you can prove that your application is returning the correct data. JMeter highlights when an assertion fails.
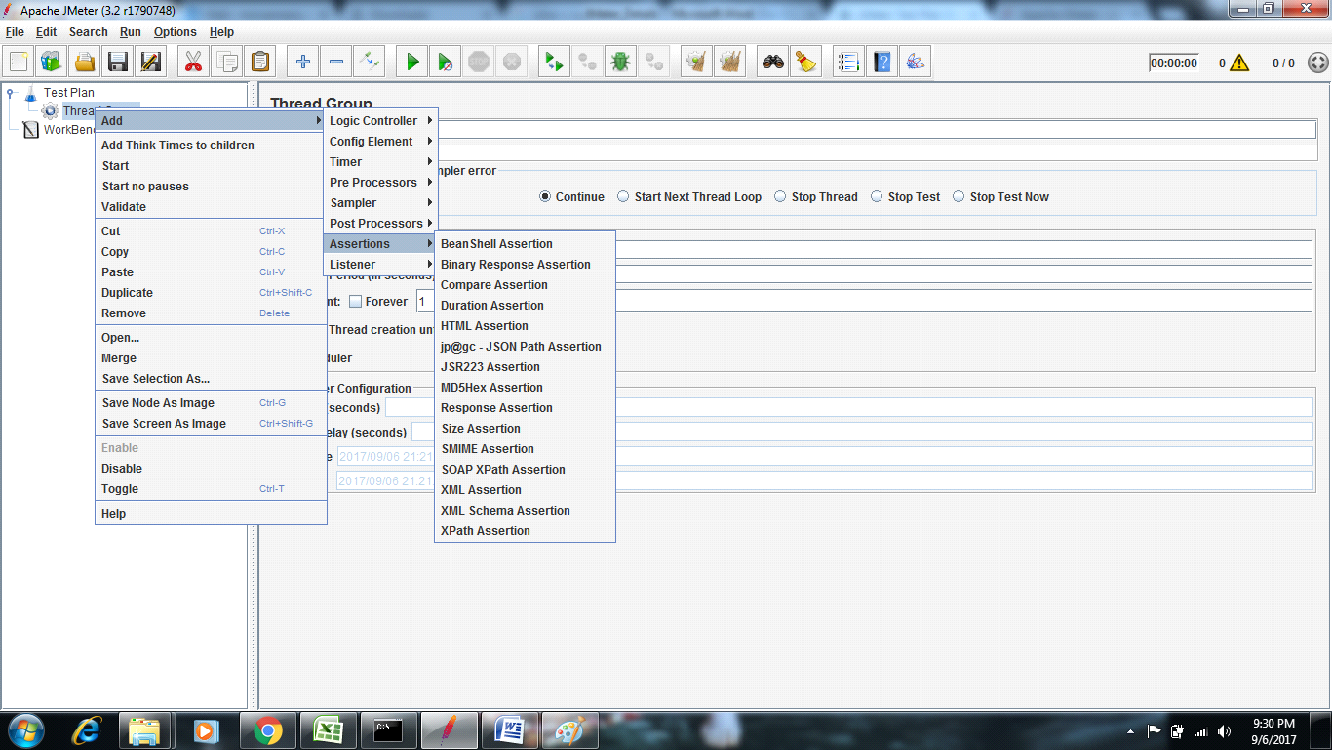
The following list consists of all the assertions JMeter provides
Compare Assertion
JSR223 Assertion
Response Assertion
Duration Assertion
Size Assertion
Configuration Elements:
Configuration Elements allow you to create defaults and variables to be used by Samplers. They are used to add or modify requests made by Samplers.
They are executed at the start of the scope of which they are part, before any Samplers that are located in the same scope. Therefore, a Configuration Element is accessed only from inside the branch where it is placed.

The following list consists of all the Configuration Elements that JMeter provides −
Counter
CSV Data Set Config
FTP Request Defaults
HTTP Authorization Manager
HTTP Cache Manager
HTTP Cookie Manager
HTTP Proxy Server
HTTP Request Defaults
HTTP Header Manager
Java Request Defaults
JDBC Connection Configuration
Login Config Element
User Defined Variables
Pre-processor Elements:
A pre-processor element is something that runs just before a sampler executes. They are often used to modify the settings of a Sample Request just before it runs, or to update variables that are not extracted from response text.
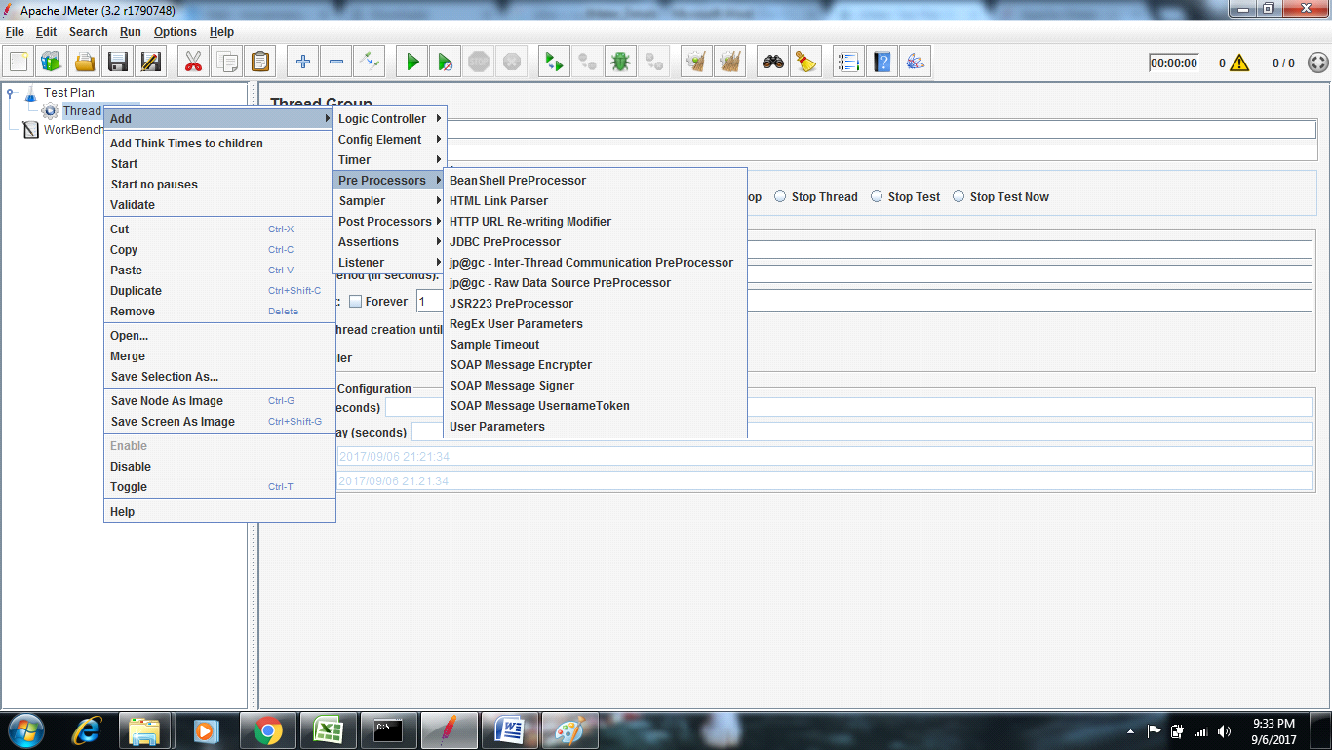
The following list consists of all the pre-processor elements that JMeter provides −
HTML Link Parser
HTTP URL Re-writing Modifier
User Parameters
BeanShell PreProcessor
Post-processor Elements:
A post-processor executes after a sampler finishes its execution. This element is most often used to process the response data, for example, to retrieve a particular value for later use.
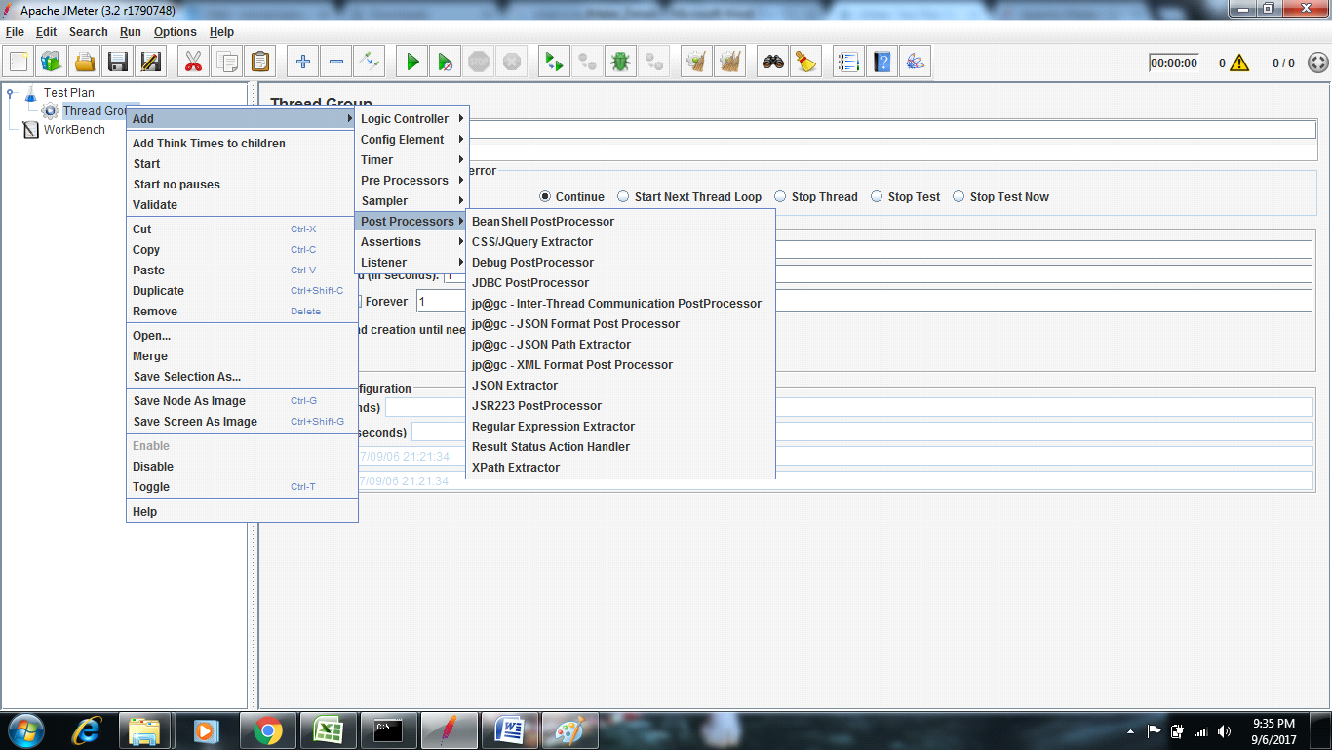
The following list consists of all the Post-Processor Elements JMeter provides −
Regular Expression Extractor
XPath Extractor
BeanShell PostProcessor
Execution Order of Test Elements:
The execution order of the elements in a Jmeter test plan is –
Configuration elements
Pre-Processors
Timers
Sampler
Post-Processors
Assertions
Listeners
GRAFANA
What is Grafana : Grafana is an open source metric analytics & visualization suite. It is most commonly used for visualizing time series data for infrastructure and application analytics but many use it in other domains including industrial sensors, home automation, weather, and process control.
Installation
Grafana is a frontend for Graphite, InfluxDB and OpenTSDB with powerfull visualization features for time series data. You will need either a Graphite, InfluxDB or OpenTSDB server for Grafana to be of any use.
Download
Download the latest release. The release package contain a subfolder, for example grafana-1.7.0. The contents of this folder should be hosted by a web server, for example nginx, apache, IIS. The standard release packages does not contain a web server to host Grafana.
Dependencies
There are no dependencies, Grafana is a client side application that runs in your browser. It only needs a time series store where it can fetch metrics. If you use InfluxDB Grafana can use it to store dashboards. If you use Graphite or OpenTSDB you can use Elasticsearch to store dashboards or just use json files stored on disk.
Configuration
In your chosen Grafana install location, locate the file config.sample.js and copy or rename it to config.js. This files contains global settings for your Grafana installation.
Datasources
The datasources property defines your metric, annotation and dashboard storage backends.
You can specify multiple datasources.
default: true marks it as the default metric source (if you have multiple)
grafanaDB: true marks it for use as dashboard storage (applicable for InfluxDB & Elasticsearch)
How to use Grafana :
Let’s start with creating a new Dashboard. You can find the new Dashboard link on the right side of the Dashboard picker. You now have a blank Dashboard.
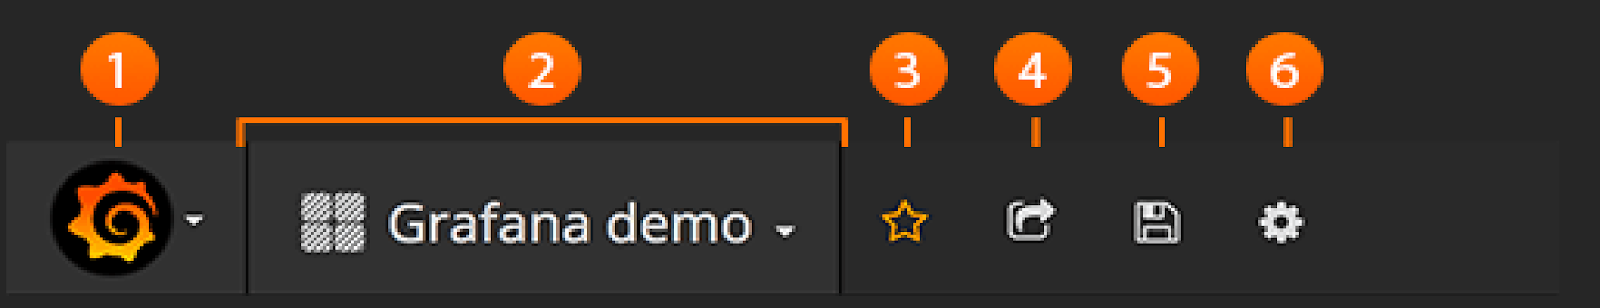
The image above shows you the top header for a Dashboard.
Side menubar toggle: This toggles the side menu, allowing you to focus on the data presented in the dashboard. The side menu provides access to features unrelated to a Dashboard such as Users, Organizations, and Data Sources.
Dashboard dropdown: This dropdown shows you which Dashboard you are currently viewing, and allows you to easily switch to a new Dashboard. From here you can also create a new Dashboard, Import existing Dashboards, and manage Dashboard playlists.
Star Dashboard: Star (or unstar) the current Dashboard. Starred Dashboards will show up on your own Home Dashboard by default, and are a convenient way to mark Dashboards that you’re interested in.
Share Dashboard: Share the current dashboard by creating a link or create a static Snapshot of it. Make sure the Dashboard is saved before sharing.
Save dashboard: The current Dashboard will be saved with the current Dashboard name.
Settings: Manage Dashboard settings and features such as Templating and Annotations.
Dashboards, Panels, Rows, the building blocks of Grafana
Dashboards are at the core of what Grafana is all about. Dashboards are composed of individual Panels arranged on a number of Rows. Grafana ships with a variety of Panels. Grafana makes it easy to construct the right queries, and customize the display properties so that you can create the perfect Dashboard for your need. Each Panel can interact with data from any configured Grafana Data Source (currently InfluxDB, Graphite, OpenTSDB, Prometheus and Cloudwatch). The Basic Concepts guide explores these key ideas in detail.
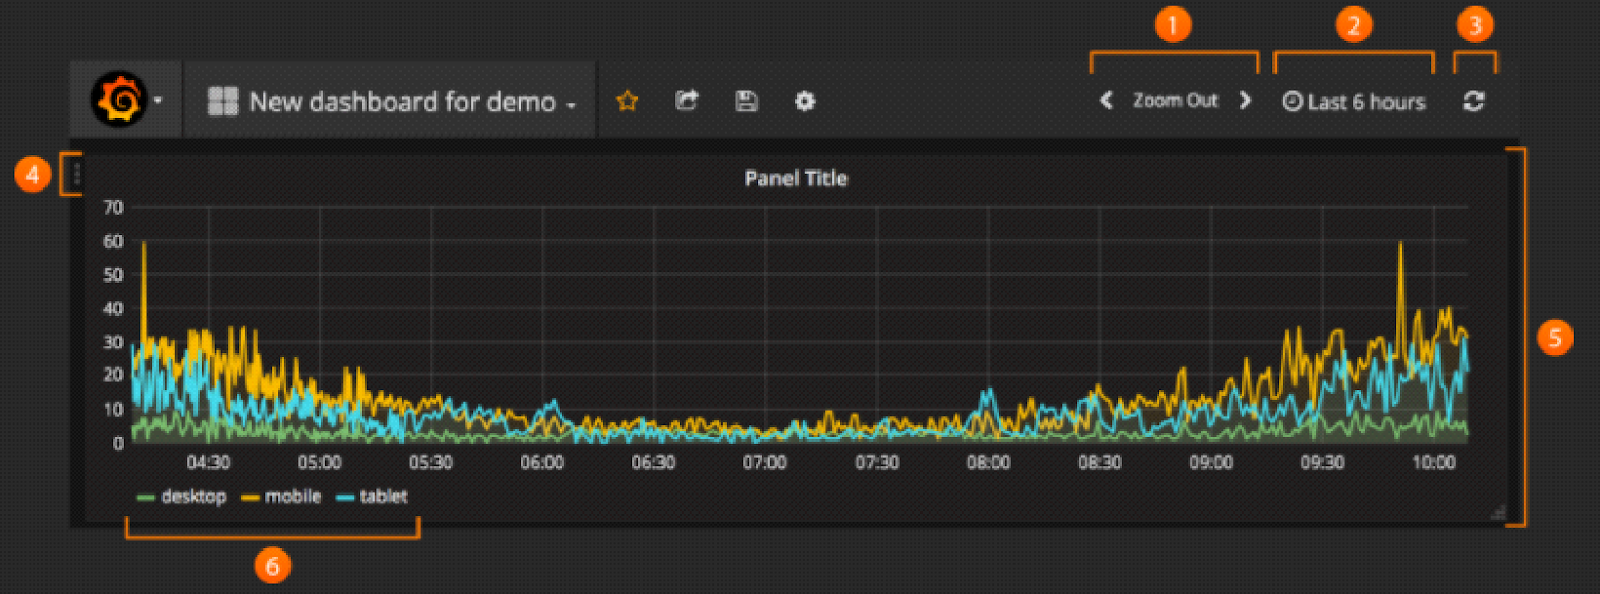
Zoom out time range
Time picker dropdown. Here you can access relative time range options, auto refresh options and set custom absolute time ranges.
Manual refresh button. Will cause all panels to refresh (fetch new data).
Row controls menu. Via this menu you can add panels to the row, set row height and more.
Dashboard panel. You edit panels by clicking the panel title.
Graph legend. You can change series colors, y-axis and series visibility directly from the legend.
Adding & Editing Graphs and Panels

You add panels via row menu. The row menu is the icon to the left of each row.
To edit the graph you click on the graph title to open the panel menu, then Edit.
This should take you to the Metrics tab. In this tab you should see the editor for your default data source.
When you click the Metrics tab, you are presented with a Query Editor that is specific to the Panel Data Source. Use the Query Editor to build your queries and Grafana will visualize them in real time.
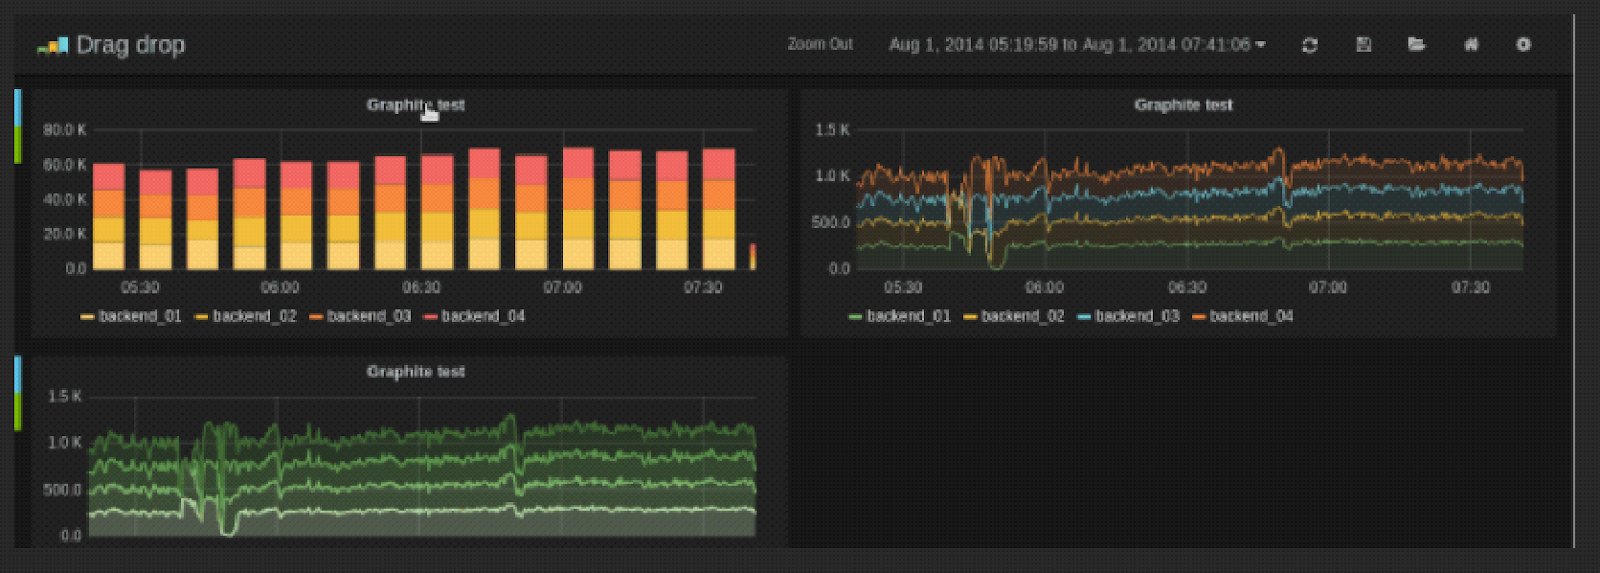
Drag-and-Drop panels
You can Drag-and-Drop Panels within and between Rows. Click and hold the Panel title, and drag it to its new location. You can also easily resize panels by clicking the (-) and (+) icons.
Tips and shortcuts
Click the graph title and in the dropdown menu quickly change span or duplicate the panel.
Click the Save icon in the menu to save the dashboard with a new name
Click the Save icon in the menu and then advanced to export the dashboard to json file, or set it as your default dashboard.
Click the colored icon in the legend to select series color
Click series name in the legend to hide series
6. Ctrl/Shift/Meta + Click legend name to hide other series
Grafana Keyboard shortcuts
Ctrl+S Saves the current dashboard
Ctrl+F Opens the dashboard finder / search
Ctrl+H Hides all controls (good for tv displays)
Hit Escape to exit graph when in fullscreen or edit mode
InfluxDB
What is InfluxDB : InfluxDB is an open-source time series database developed by InfluxData. It is written in Go and optimized for fast, high-availability storage and retrieval of time series data in fields such as operations monitoring, application metrics, Internet of Things sensor data, and real-time analytics. It also has support for processing data from Graphite.
Installation:
Download and install “Github”
Download and install “Go” Programming language installer.
Download and install “Tortoisehg”
Run command line mode below
Compile InfluxDB
Open an elevated command prompt and enter the following:
cd c:\go
mkdir projects
set "GOPATH=C:\Go\projects"
cd %gopath%
go get github.com/influxdata/influxdb
cd src\github.com\influxdata\influxdb
go get -u -f ./...
go build ./...
Create the InfluxDB Config File
cd c:\go\projects\bin
influxd config > influxdb.generated.conf
copy influxdb.generated.conf influxdb.conf
Modify the Config File
start wordpad influxdb.conf
Launch InfluxDB
influxd –config influxdb.conf
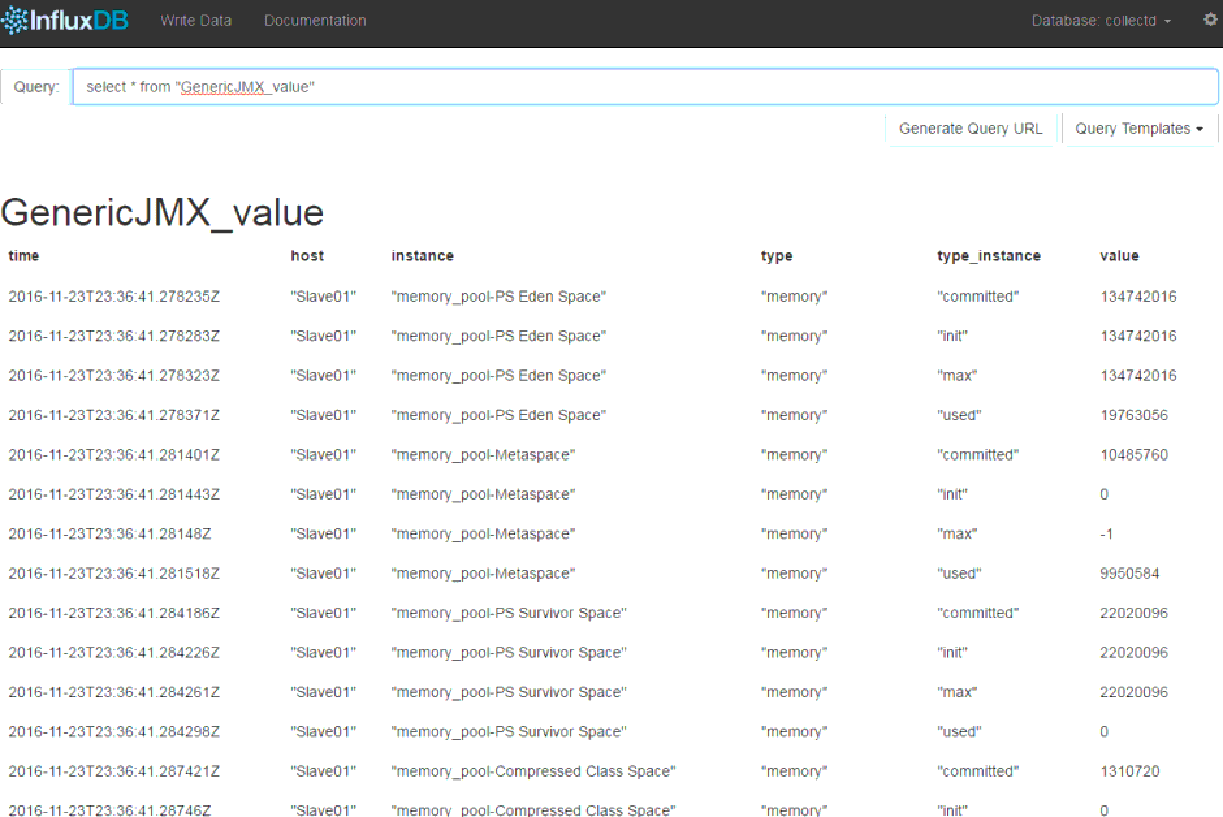
After this configuration launch influx in your browser.
How to Configure Jmeter and Grafana
Since JMeter 2.13 you can get real-time results sent to a backend through the Backend Listener using potentially any backend (JDBC, JMS, Webservice, …) by providing a class which implements AbstractBackendListenerClient.
JMeter ships with:
a GraphiteBackendListenerClient which allows you to send metrics to a Graphite Backend.
This feature provides:Live results
Nice graphs for metrics
Ability to compare 2 or more load tests
Storing monitoring data as long as JMeter results in the same backend
an InfluxDBBackendListenerClient introduced in JMeter 3.2 which allows you to send metrics to an InfluxDB Backend using UDP or HTTP protocols This feature provides:
Live results
Nice graphs for metrics
Ability to compare 2 or more load tests
Ability to add annotations to graphs
Storing monitoring data as long as JMeter results in the same backend
In this document we will present the configuration setup to graph and historize the data in different backends:
InfluxDB setup for InfluxDBBackendListenerClient
InfluxDB setup for GraphiteBackendListenerClient
Grafana
Graphite
JMeter configuration
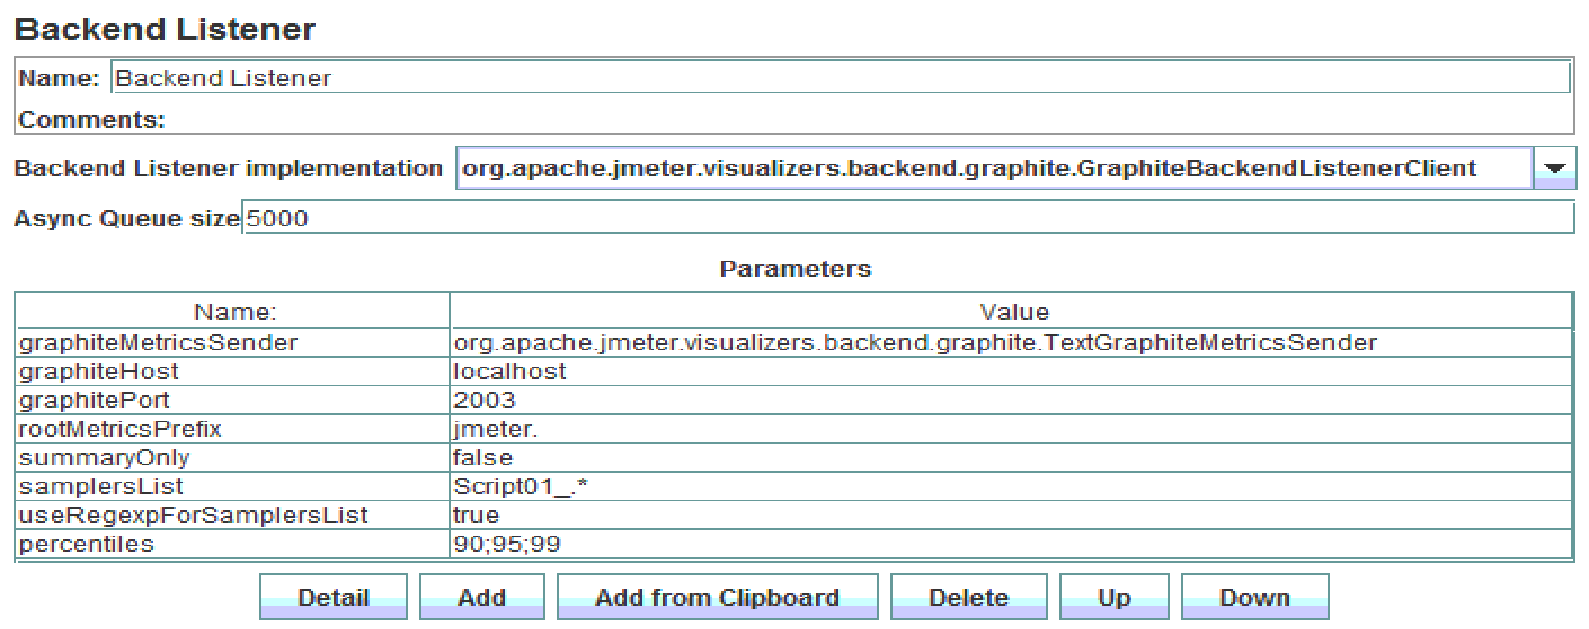
To make JMeter send metrics to backend add a BackendListener using the GraphiteBackendListenerClient.
InfluxDB database configuration
Connect to InfluxDB using influx shell and create two databases:
grafana : Used by Grafana to store the dashboards we will create
jmeter : Used by InfluxDB to store the data sent to Graphite Listener as per database="jmeter" config element in influxdb.conf
InfluxDB setup for InfluxDBBackendListenerClient
InfluxDB is an open-source, distributed, time-series database that allows to easily store metrics. Installation and configuration is very easy, read this for more details InfluxDB documentation.
InfluxDB data can be easily viewed in a browser through either Influga or Grafana. We will use Grafana in this case. There is no particular configuration to setup when using InfluxDBBackendListenerClient
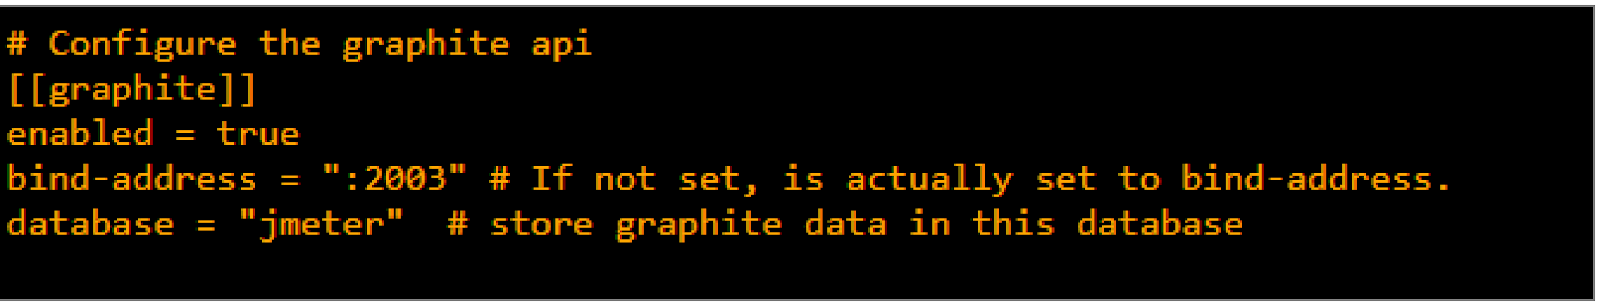
InfluxDB setup for GraphiteBackendListenerClient
To enable Graphite listener in InfluxDB for GraphiteBackendListenerClient, edit files /opt/influxdb/shared/config.toml or /usr/local/etc/influxdb.conf, find "[[graphite]]" and set this
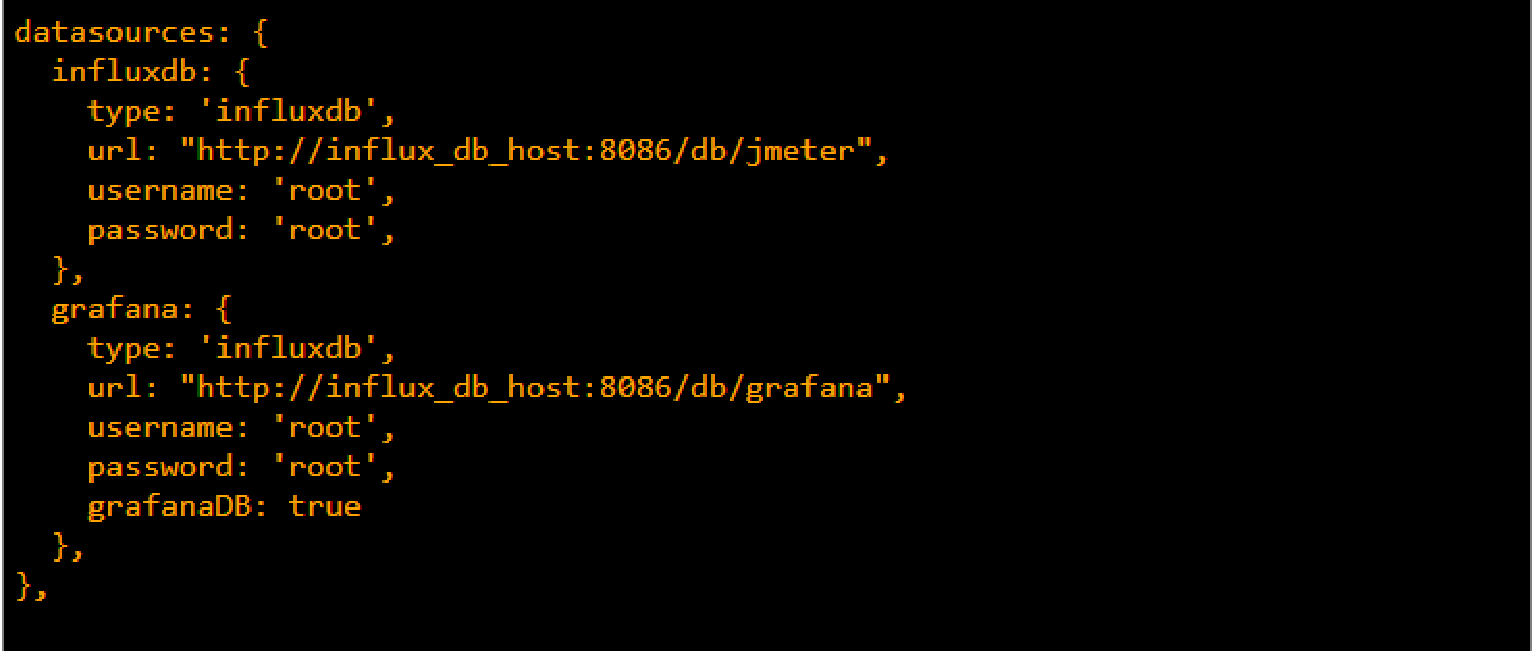
Grafana configuration
Installing grafana is just a matter of putting the unzipped bundle behind an Apache HTTP server.
Read documentation for more details. Open config.js file and find datasources element, and edit it like this:
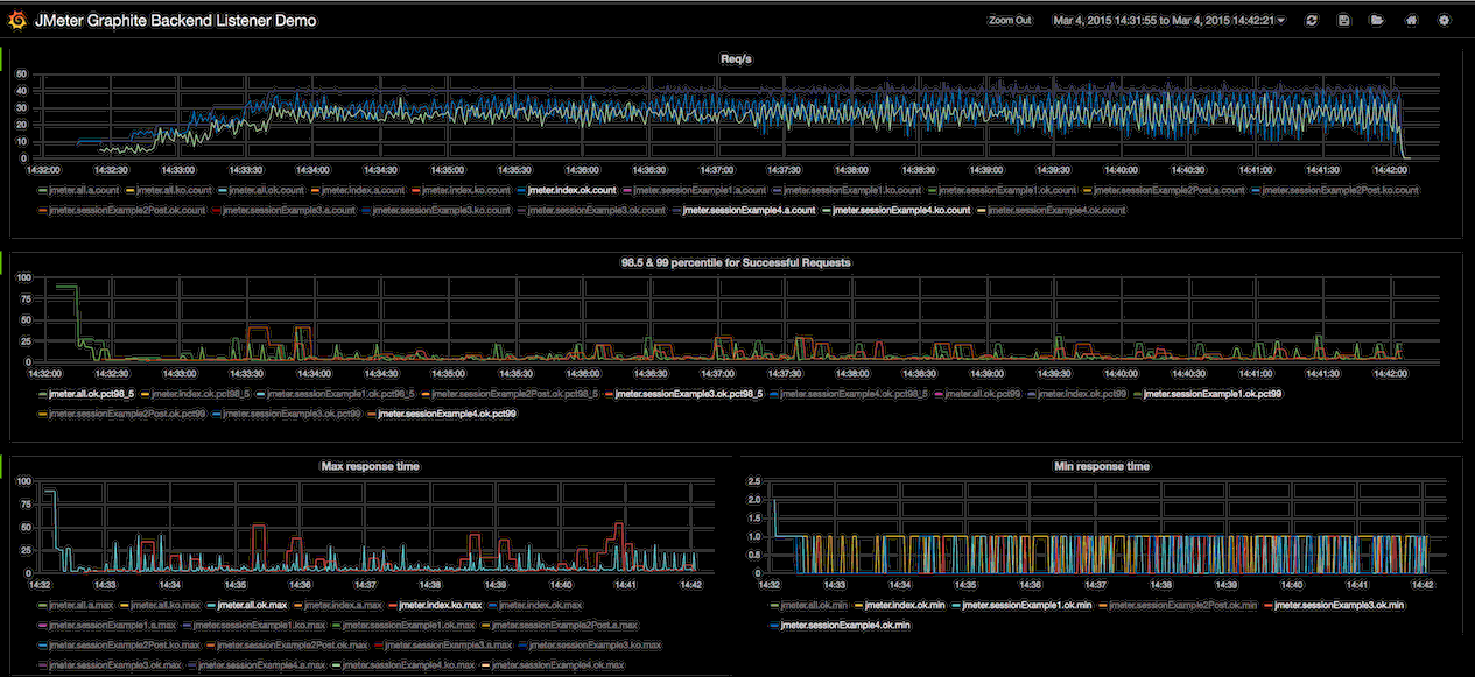
Here is the kind of dashboard that you could obtain:
Grafana Codes for various Metrics:
Thread/Virtual Users metrics
Thread metrics are the following:
<rootMetricsPrefix>test.minAT
Min active threads
<rootMetricsPrefix>test.maxAT
Max active threads
<rootMetricsPrefix>test.meanAT
Mean active threads
<rootMetricsPrefix>test.startedT
Started threads
<rootMetricsPrefix>test.endedT
Finished threads
Response times metrics
Response related metrics are the following:
<rootMetricsPrefix><samplerName>.ok.count
Number of successful responses for sampler name
<rootMetricsPrefix><samplerName>.h.count
Server hits per seconds, this metric cumulates Sample Result and Sub results (if using Transaction Controller, "Generate parent sampler" should be unchecked)
<rootMetricsPrefix><samplerName>.ok.min
Min response time for successful responses of sampler name
<rootMetricsPrefix><samplerName>.ok.max
Max response time for successful responses of sampler name
<rootMetricsPrefix><samplerName>.ok.avg
Average response time for successful responses of sampler name.
<rootMetricsPrefix><samplerName>.ok.pct<percentileValue>
Percentile computed for successful responses of sampler name. There will be one metric for each calculated value.
<rootMetricsPrefix><samplerName>.ko.count
Number of failed responses for sampler name
<rootMetricsPrefix><samplerName>.ko.min
Min response time for failed responses of sampler name
<rootMetricsPrefix><samplerName>.ko.max
Max response time for failed responses of sampler name
<rootMetricsPrefix><samplerName>.ko.avg
Average response time for failed responses of sampler name.
<rootMetricsPrefix><samplerName>.ko.pct<percentileValue>
Percentile computed for failed responses of sampler name. There will be one metric for each calculated value.
<rootMetricsPrefix><samplerName>.a.count
Number of responses for sampler name (sum of ok.count and ko.count)
<rootMetricsPrefix><samplerName>.a.min
Min response time for responses of sampler name (min of ok.count and ko.count)
<rootMetricsPrefix><samplerName>.a.max
Max response time for responses of sampler name (max of ok.count and ko.count)
<rootMetricsPrefix><samplerName>.a.avg
Average response time for responses of sampler name (avg of ok.count and ko.count)
<rootMetricsPrefix><samplerName>.a.pct<percentileValue>
Percentile computed for responses of sampler name. There will be one metric for each calculated value. (calculated on the totals for OK and failed samples)
The default percentiles setting on the Backend Listener is "90;95;99", i.e. the 3 percentiles 90%, 95% and 99%.
The Graphite naming hierarchy uses dot (".") to separate elements. This could be confused with decimal percentile values. JMeter converts any such values, replacing dot (".") with underscore ("-"). For example, "99.9" becomes "99_9"
By default JMeter sends metrics for all samplers accumulated under the samplerName "all". If the Backend Listener samplersList is configured, then JMeter also sends the metrics for the matching sample names unless summaryOnly=true


Comments
Post a Comment