JMeter With Kubernetes
JMeter Kubernetes
Installation
Process
Ubuntu Installation on Windows
Windows Subsystem for Linux Installation Guide for Windows 10
Install the Windows Subsystem for Linux
Before installing any Linux distributions on Windows, you must enable the "Windows Subsystem for Linux" optional feature.
Open PowerShell as Administrator and run:
dism.exe /online /enable-feature /featurename:Microsoft-Windows-Subsystem-Linux /all /norestart
To only install WSL 1, you should now restart your machine and move on to https://docs.microsoft.com/en-us/windows/wsl/install-win10#install-your-linux-distribution-of-choice otherwise wait to restart and move on to update to WSL 2. Read more about https://docs.microsoft.com/en-us/windows/wsl/compare-versions
Update to WSL 2
To update to WSL 2, you must meet the following criteria:
Running Windows 10, updated to version 2004, Build 19041 or higher.
Check your Windows version by selecting the Windows logo key + R, type winver, select OK. (Or enter the ver command in Windows Command Prompt). Please update to the latest Windows version if your build is lower than 19041. Get Windows Update Assistant.
Enable the 'Virtual Machine Platform' optional component
Before installing WSL 2, you must enable the "Virtual Machine Platform" optional feature.
Open PowerShell as Administrator and run:
dism.exe /online /enable-feature /featurename:VirtualMachinePlatform /all /norestart
Restart your machine to complete the WSL install and update to WSL 2.
Set WSL 2 as your default version
Run the following command in PowerShell to set WSL 2 as the default version when installing a new Linux distribution:
wsl --set-default-version 2
You might see this message after running that command: WSL 2 requires an update to its kernel component. For information please visit https://aka.ms/wsl2kernel. Please follow the link (https://aka.ms/wsl2kernel) and install the MSI from that page on our documentation to install a Linux kernel on your machine for WSL 2 to use. Once you have the kernel installed, please run the command again and it should complete successfully without showing the message.
Note
The update from WSL 1 to WSL 2 may take several minutes to complete depending on the size of your targeted distribution. If you are running an older (legacy) installation of WSL 1 from Windows 10 Anniversary Update or Creators Update, you may encounter an update error. Follow these instructions to uninstall and remove any legacy distributions.
If wsl --set-default-version results as an invalid command, enter wsl --help. If the --set-default-version is not listed, it means that your OS doesn't support it and you need to update to version 2004, Build 19041 or higher.
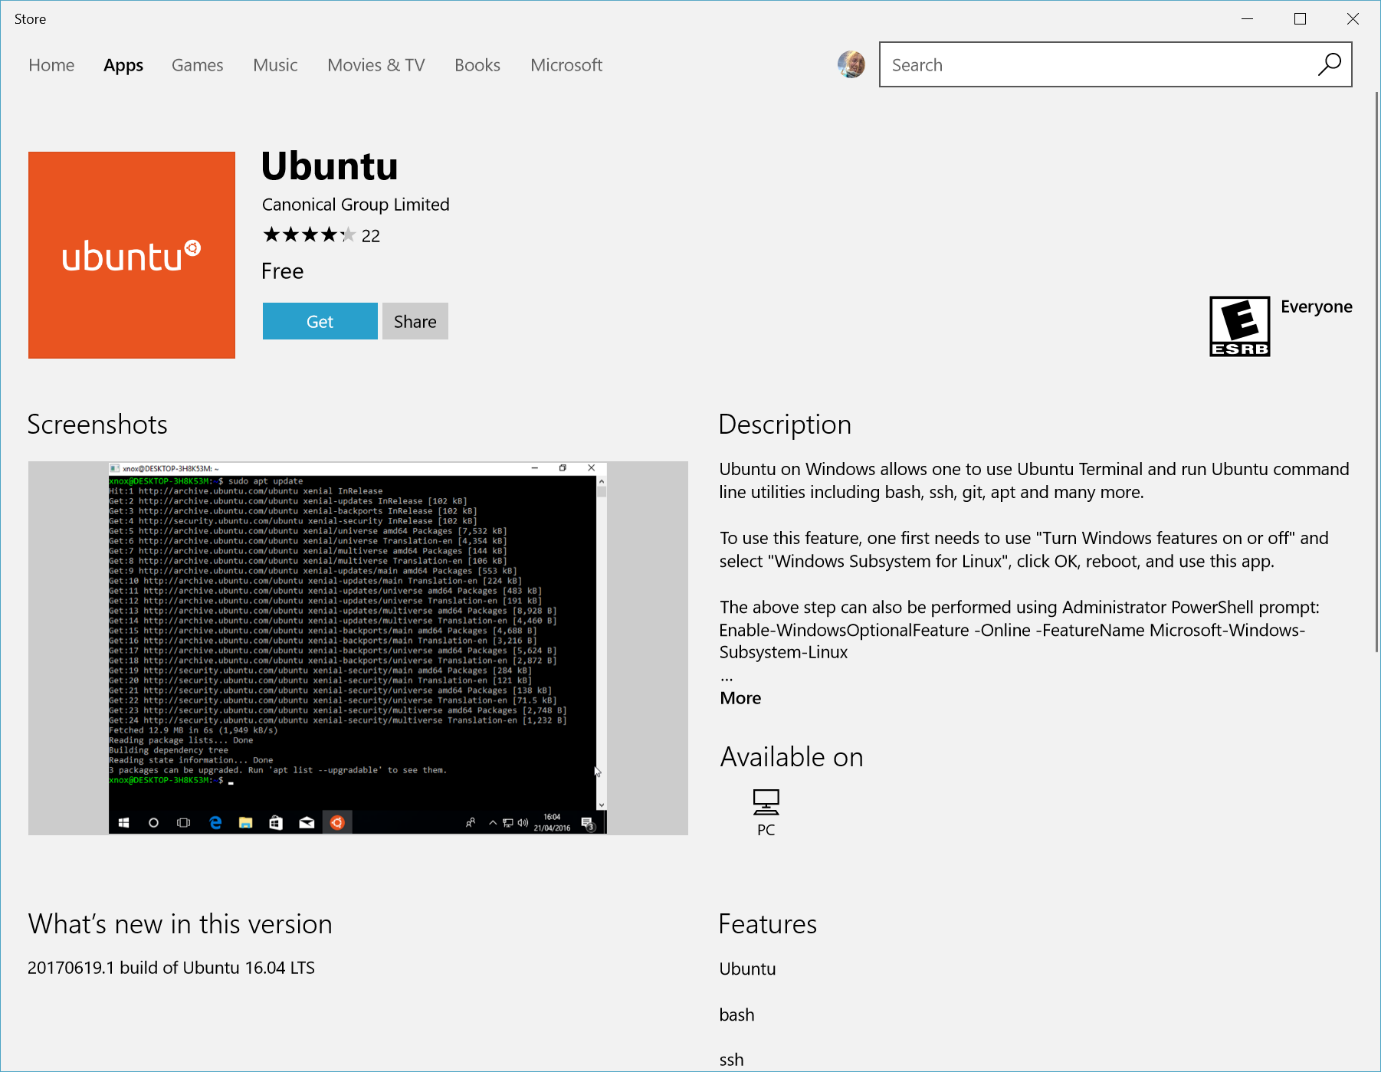
Install your Linux distribution of choice
Open the Microsoft Store and select your favourite Linux distribution.
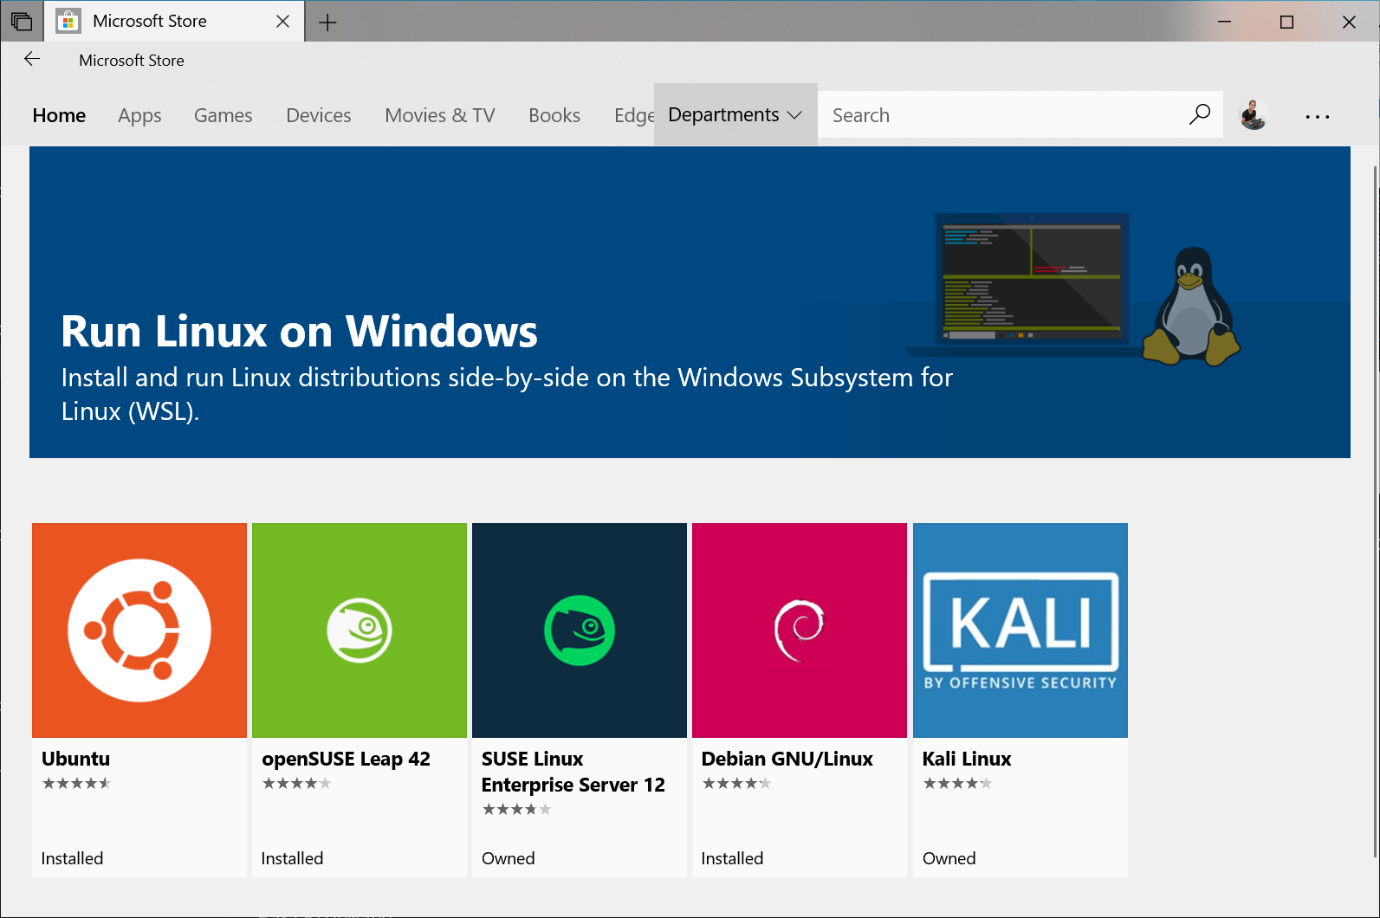
The following links will open the Microsoft store page for each distribution:
From the distribution's page, select "Get".
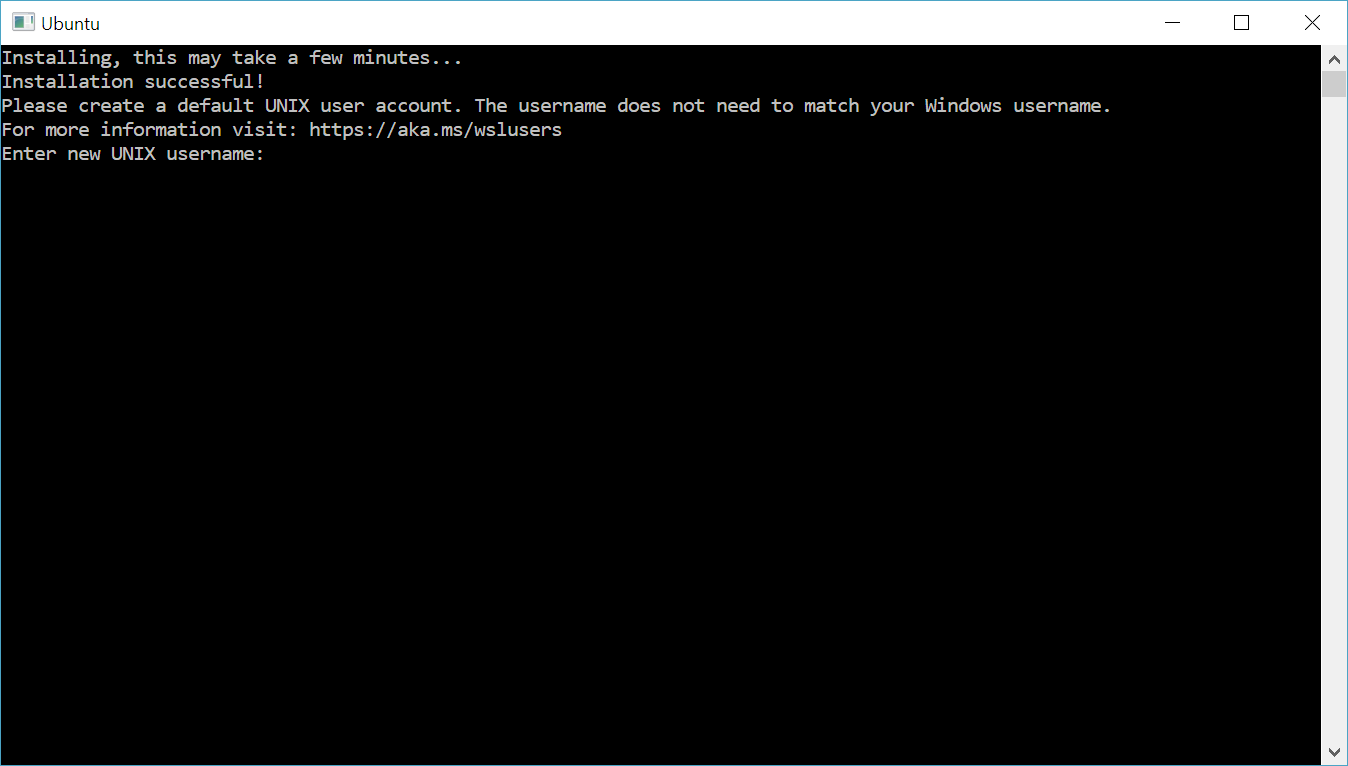
Set up a new distribution
The first time you launch a newly installed Linux distribution, a console window will open and you'll be asked to wait for a minute or two for files to de-compress and be stored on your PC. All future launches should take less than a second.
You will then need to create a user account and password for your new Linux distribution.
Set your distribution version to WSL 1 or WSL 2
You can check the WSL version assigned to each of the Linux distributions you have installed by opening the PowerShell command line and entering the command (only available in Windows Build 19041 or higher): wsl -l -v
wsl --list –verbose
To set a distribution to be backed by either version of WSL please run:
wsl --set-version <distribution name> <versionNumber>
Make sure to replace <distribution name> with the actual name of your distribution and <versionNumber> with the number '1' or '2'. You can change back to WSL 1 at anytime by running the same command as above but replacing the '2' with a '1'.
Additionally, if you want to make WSL 2 your default architecture you can do so with this command:
wsl --set-default-version 2
This will set the version of any new distribution installed to WSL 2.
Troubleshooting installation
Below are related errors and suggested fixes. Refer to the https://docs.microsoft.com/en-us/windows/wsl/troubleshooting other common errors and their solutions.
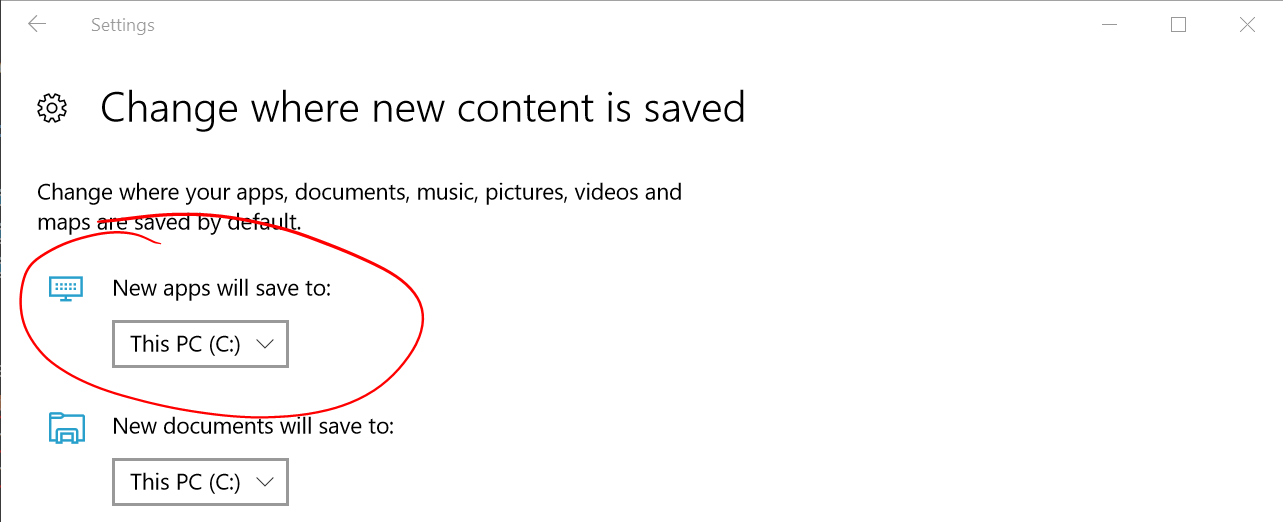
Installation failed with error 0x80070003
The Windows Subsystem for Linux only runs on your system drive (usually this is your C: drive). Make sure that distributions are stored on your system drive:
Open Settings -> Storage -> More Storage Settings: Change where new content is saved
WslRegisterDistribution failed with error 0x8007019e
The Windows Subsystem for Linux optional component is not enabled:
Open Control Panel -> Programs and Features -> Turn Windows Feature on or off -> Check Windows Subsystem for Linux or using the PowerShell cmdlet mentioned at the beginning of this article.
Installation failed with error 0x80070003 or error 0x80370102
Please make sure that virtualization is enabled inside of your computer's BIOS. The instructions on how to do this will vary from computer to computer, and will most likely be under CPU related options.
Error when trying to upgrade: Invalid command line option: wsl --set-version Ubuntu 2
Please make sure that you have the Windows Subsystem for Linux enabled, and that you're using Windows Build version 19041 or higher. To enable WSL run this command in a PowerShell prompt with admin privileges: Enable-WindowsOptionalFeature -Online -FeatureName Microsoft-Windows-Subsystem-Linux. You can find the full WSL install instructions here.
The requested operation could not be completed due to a virtual disk system limitation. Virtual hard disk files must be uncompressed and unencrypted and must not be sparse.
Please check WSL GitHub thread #4103 where this issue is being tracked for updated information.
The term 'wsl' is not recognized as the name of a cmdlet, function, script file, or operable program.
Ensure that the Windows Subsystem for Linux Optional Component is installed. Additionally, if you are using an ARM64 device and running this command from PowerShell, you will receive this error. Instead run wsl.exe from PowerShell Core, or Command Prompt.
Enable WSL 2 on Docker
Install
Ensure you have completed the steps described in the Prerequisites section before installing the Docker Desktop Stable 2.3.0.2 release.
Follow the usual installation instructions to install Docker Desktop. If you are running a supported system, Docker Desktop prompts you to enable WSL 2 during installation. Read the information displayed on the screen and enable WSL 2 to continue.
Start Docker Desktop from the Windows Start menu.
From the Docker menu, select Settings > General.
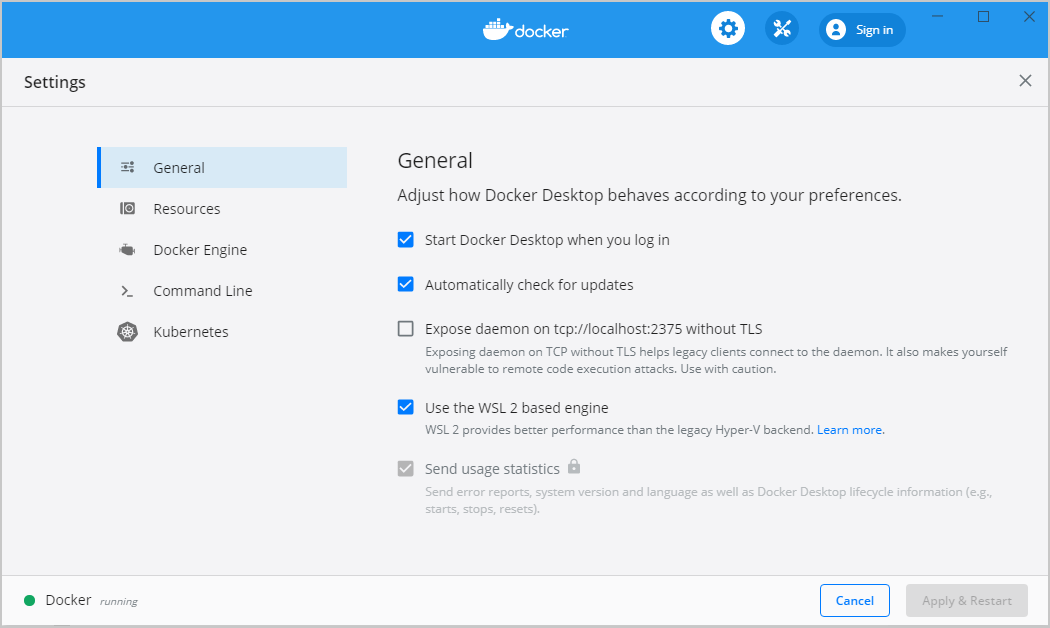
Select the Use WSL 2 based engine check box.
If you have installed Docker Desktop on a system that supports WSL 2, this option will be enabled by default.
Click Apply & Restart.
Ensure the distribution runs in WSL 2 mode. WSL can run distributions in both v1 or v2 mode.
To check the WSL mode, run
wsl -l -v
To upgrade your existing Linux distro to v2, run:
wsl --set-version (distro name) 2
To set v2 as the default version for future installations, run:
wsl --set-default-version 2
When Docker Desktop restarts, go to Settings > Resources > WSL Integration.
WSL Integration will be enabled on your default WSL distribution. To change your default WSL distro, run wsl --set-default <distro name>.
For example, to set Ubuntu as your default WSL distro, run wsl --set-default ubuntu.
Optionally, select any additional distributions you would like to enable WSL 2 on.
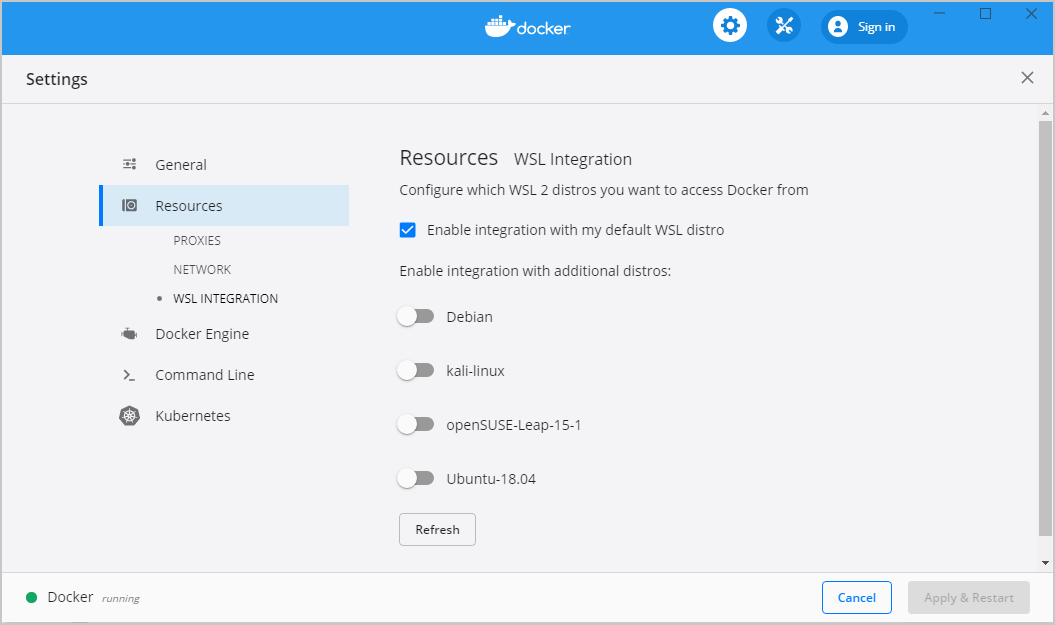
Click Apply & Restart.
Develop with Docker and WSL 2
The following section describes how to start developing your applications using Docker and WSL 2. We recommend that you have your code in your default Linux distribution for the best development experience using Docker and WSL 2. After you have enabled WSL 2 on Docker Desktop, you can start working with your code inside the Linux distro and ideally with your IDE still in Windows. This workflow can be pretty straightforward if you are using VSCode.
Open VSCode and install the Remote - WSL extension. This extension allows you to work with a remote server in the Linux distro and your IDE client still on Windows.
Now, you can start working in VSCode remotely. To do this, open your terminal and type:
wsl
code .
This opens a new VSCode connected remotely to your default Linux distro which you can check in the bottom corner of the screen.
Alternatively, you can type the name of your default Linux distro in your Start menu, open it, and then run code .
When you are in VSCode, you can use the terminal in VSCode to pull your code and start working natively from your Windows machine.
Refer: https://docs.docker.com/docker-for-windows/wsl/
Install and Set Up kubectl on Ubuntu
1. Check the java version first (java --version)
2. Run sudo apt-get update
3. Run sudo apt-get install jmeter
Refer: https://www.youtube.com/watch?v=7mwodWkhqIk
Jmeter-Kubernetes
This operator was created to simplify the process of deploying a Jmeter cluster on kubernetes.
The operator is capable of creating the following resources:
- Jmeter Master
- Jmeter Slaves
- InfluxDB for metrics storage (optional)
- Grafana to visualize the load testing metrics (optional)
- Grafana reporter module, this is used to generate PDF reports of your load tests (optional)
This effort is based partially on https://github.com/kubernauts/jmeter-kubernetes, if you desire an alternative deployment experience, you can check the repo further.
The steps to use this operator is as follows:
(1.) Clone this repo "git clone https://github.com/kubernauts/jmeter-operator.git"
(2.) Install the Jmeter CRD (custom resource definition):
"kubectl apply -f deploy/crds/loadtest_v1alpha1_jmeter_crd.yaml".
This is a cluster-wide scope operator, the reason for this is that multiple Jmeter clusters may be needed within an organization but there is nothing stopping you from using just one Jmeter deployment but it is strongly advised that you run it in a dedicated namespace which will we will as we proceed
(3.) Confirm that the CRD has been installed "kubectl get crd | grep jmeter" or "kubectl describe crd jmeters.loadtest.jmeter.com"
From "kubectl describe crd jmeters.loadtest.jmeter.com", you should below as part of the output:
Group: loadtest.jmeter.com
Names:
Kind: Jmeter
List Kind: JmeterList
Plural: jmeters
Singular: jmeter
Scope: Namespaced
Subresources:
Status:
Version: v1alpha1
Versions:
Name: v1alpha1
Served: true
Storage: true
Status:
Accepted Names:
Kind: Jmeter
List Kind: JmeterList
Plural: jmeters
Singular: jmeter
Conditions:
(4.) Deploy the Jmeter operator deployment "kubectl apply -f deploy/" , this is what will watch the API for any jmeter CRD objects, once it detects the jmeter CRD, it will proceed to process that request and create the necessary kubernetes objects
Check the status for the operator deployment (this is deployed in kube-system namespace by default)
kubectl -n kube-system get pods | grep jmeter
jmeter-operator-6f54d969c7-w4h4l 1/1 Running 0 2m
(5.) Create a namespace for the jmeter deployment: "kubectl create namespace tqa"
(6.) Create a Jmeter deployment manifest (e.g jmeter-deploy.yaml), example is given below:
apiVersion: loadtest.jmeter.com/v1alpha1
kind: Jmeter
metadata:
name: tqa-loadtest
namespace: tqa
spec:
# Add fields here
slave_size: 2
jmeter_master_image: kubernautslabs/jmeter_master:latest
jmeter_slave_image: kubernautslabs/jmeter_slave:latest
grafana_server_root: /
grafana_service_type: LoadBalancer
grafana_image: grafana/grafana:5.2.0
influxdb_image: influxdb
grafana_install: "true"
grafana_reporter_install: "false"
grafana_reporter_image: kubernautslabs/jmeter-reporter:latest
influxdb_install: "true"
Run "kubectl create -f jmeter-deploy.yaml". As you can see, you can enable optional features and also modify some parameters like service type for the Grafana deployment (e.g. you can set this to ClusterIP if you want to expose the service via an Ingress) and the container images.
N.B -- The "grafana_service_type" controls the kind of service type for both Grafana and Grafana Reporter
Confirm that the resources have been created:
kubectl -n tqa get jmeter
NAME AGE
tqa-loadtest 1m
kubectl -n tqa get all
NAME READY STATUS RESTARTS AGE
pod/tqa-loadtest-grafana-dc9749dc9-4ggxg 1/1 Running 0 3m
pod/tqa-loadtest-influxdb-78b6c859cd-jstps 1/1 Running 0 3m
pod/tqa-loadtest-jmeter-master-66c648668-htdml 1/1 Running 0 3m
pod/tqa-loadtest-jmeter-slaves-c4787d59-275bj 1/1 Running 0 3m
pod/tqa-loadtest-jmeter-slaves-c4787d59-fptrp 1/1 Running 0 3m
NAME TYPE CLUSTER-IP EXTERNAL-IP PORT(S) AGE
service/tqa-loadtest-grafana LoadBalancer 100.64.222.93 ac6d0c369489dxxxxxxxxxxx-198965xxxx.eu-central-1.elb.amazonaws.com 3000:30882/TCP 3m
service/tqa-loadtest-influxdb ClusterIP 100.64.232.50 <none> 8083/TCP,8086/TCP,2003/TCP 3m
service/tqa-loadtest-jmeter-slaves-svc ClusterIP None <none> 1099/TCP,50000/TCP 3m
NAME DESIRED CURRENT UP-TO-DATE AVAILABLE AGE
deployment.apps/tqa-loadtest-grafana 1 1 1 1 3m
deployment.apps/tqa-loadtest-influxdb 1 1 1 1 3m
deployment.apps/tqa-loadtest-jmeter-master 1 1 1 1 3m
deployment.apps/tqa-loadtest-jmeter-slaves 2 2 2 2 3m
NAME DESIRED CURRENT READY AGE
replicaset.apps/tqa-loadtest-grafana-dc9749dc9 1 1 1 3m
replicaset.apps/tqa-loadtest-influxdb-78b6c859cd 1 1 1 3m
replicaset.apps/tqa-loadtest-jmeter-master-66c648668 1 1 1 3m
replicaset.apps/tqa-loadtest-jmeter-slaves-c4787d59 2 2 2 3m
(7.) The next step is entirely optional, they are just to make creating a Jmeter load test easier, the scripts (initialize_cluster.sh and start_test.sh) can be modified to suit your needs as you desire.
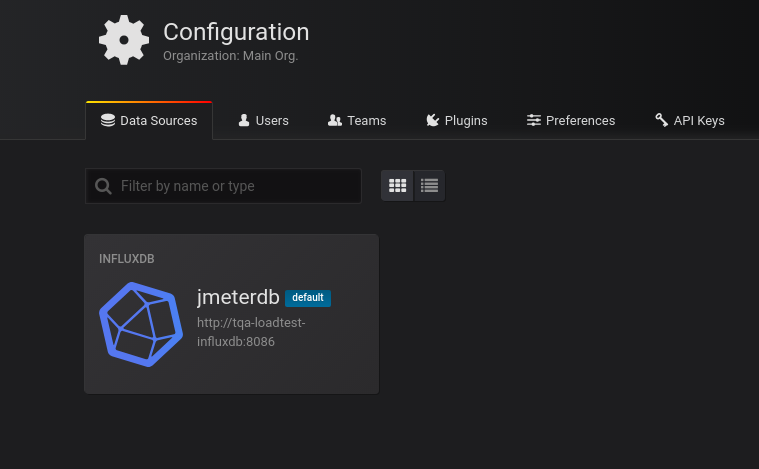
The initialize_cluster.sh script will create the database name in InfluxDB (default name is 'jmeter') and also create the InfluxDB datasource in Grafana.
The script will ask you about the namespace where the jmeter cluster was created (tqa) and then proceed to create the needed resources in InfluxDB and Grafana.
./initialize_cluster.sh
Enter the Jmeter Namespace: tqa
Creating Influxdb jmeter Database
Creating the Influxdb data source
{"datasource":{"id":1,"orgId":1,"name":"jmeterdb","type":"influxdb","typeLogoUrl":"","access":"proxy","url":"http://tqa-loadtest-influxdb:8086","password":"admin","user":"admin","database":"jmeter","basicAuth":false,"basicAuthUser":"","basicAuthPassword":"","withCredentials":false,"isDefault":true,"secureJsonFields":{},"version":1,"readOnly":false},"id":1,"message":"Datasource added","name":"jmeterdb"}
For making URL ports we will follow the below steps.
$ kubectl get po -n tqa (we will get below response)
NAME READY STATUS RESTARTS AGE
tqa-loadtest-grafana-5787d868fb-q66vf 1/1 Running 0 14m
tqa-loadtest-influxdb-5b47b98889-cm9dc 1/1 Running 0 14m
tqa-loadtest-jmeter-master-586bc5879c-mtrdd 1/1 Running 0 14m
tqa-loadtest-jmeter-slaves-7dbf755456-6vzbf 1/1 Running 0 14m
tqa-loadtest-jmeter-slaves-7dbf755456-89nqp 1/1 Running 0 14m
tqa-loadtest-jmeter-slaves-7dbf755456-skxhm 1/1 Running 0 14m
Run the below command to enable Grafana Host.
$ kubectl -n tqa port-forward tqa-loadtest-grafana-5787d868fb-lksrf 3000:3000
Response: Forwarding from 127.0.0.1:3000 -> 3000
Forwarding from [::1]:3000 -> 3000
Run the below command for getting InfluxDB code.
$ kubectl get po -n tqa
Response :
NAME READY STATUS RESTARTS AGE
tqa-loadtest-grafana-5787d868fb-q66vf 1/1 Running 0 17m
tqa-loadtest-influxdb-5b47b98889-cm9dc 1/1 Running 0 17m
tqa-loadtest-jmeter-master-586bc5879c-mtrdd 1/1 Running 0 17m
tqa-loadtest-jmeter-slaves-7dbf755456-6vzbf 1/1 Running 0 17m
tqa-loadtest-jmeter-slaves-7dbf755456-89nqp 1/1 Running 0 17m
tqa-loadtest-jmeter-slaves-7dbf755456-skxhm 1/1 Running 0 17m
Copy that above response code to enable Influx Host command and run it.
$ kubectl -n tqa port-forward tqa-loadtest-influxdb-5b47b98889-wtj6x 8086:8086
Response: Forwarding from 127.0.0.1:8086 -> 8086
Forwarding from [::1]:8086 -> 8086
(8.) You can access your Grafana now and confirm whether the datasource was created.
(9.) Run a sample jmeter test script (there is a sample test script cloudssky.jmx in this repo). This can be initiated by running "./start_test.sh".
./start_test.sh
Enter the Jmeter Namespace: tqa
Enter path to the jmx file cloudssky.jmx
Mar 17, 2019 10:37:19 AM java.util.prefs.FileSystemPreferences$1 run
INFO: Created user preferences directory.
Creating summariser <summary>
Created the tree successfully using cloudssky.jmx
Configuring remote engine: 100.96.1.107
Configuring remote engine: 100.96.3.207
Starting remote engines
Starting the test @ Sun Mar 17 10:37:19 UTC 2019 (1552819039563)
Remote engines have been started
Waiting for possible Shutdown/StopTestNow/Heapdump message on port 4445
N.B - It is important that you configure your script with the appropriate InfluxDB service name (tqa-loadtest-influxdb as per this documentation), sample is shown below:
<stringProp name="Argument.value">http://tqa-loadtest-influxdb:8086/write?db=jmeter</stringProp>
Normally you will set this via the Jmeter desktop application to make this easier.
Otherwise the graphs on Grafana may not show anything!
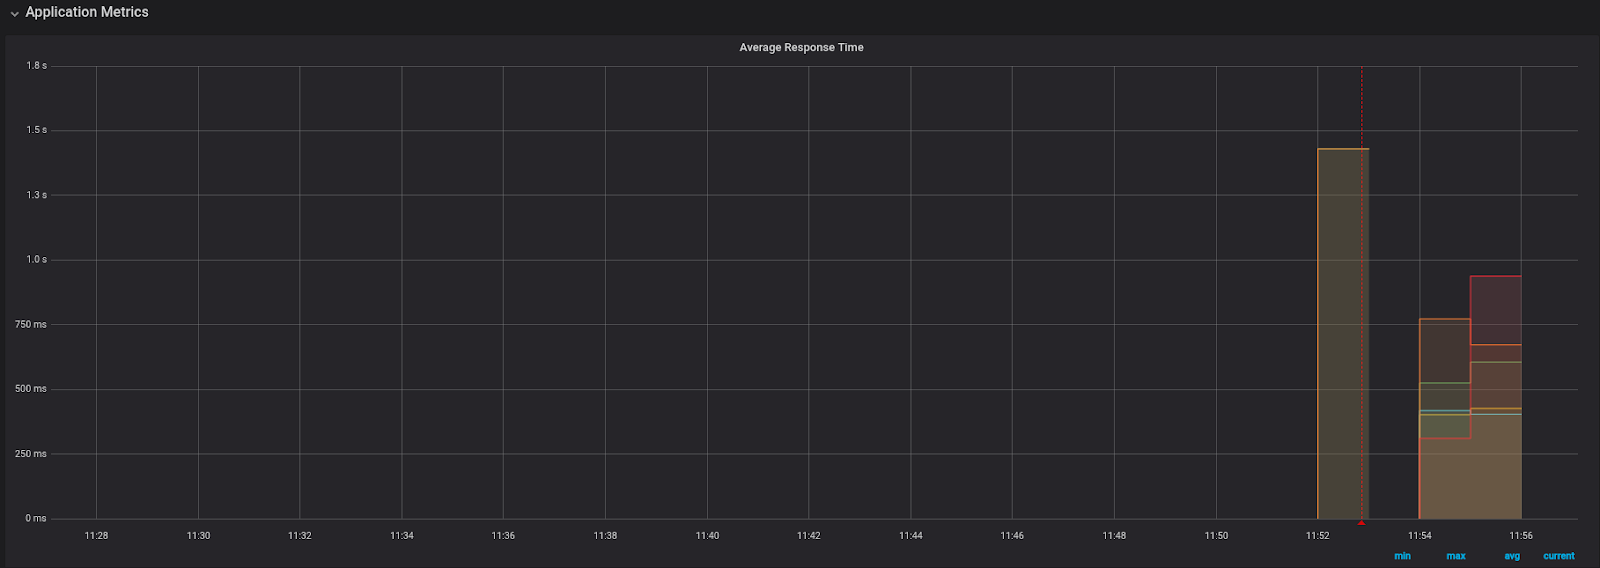
(10.) Import the sample jmeter Grafana dashboard (GrafanaJMeterTemplate.json) and select the InfluxDB datasource that was created. Check the progress of the test:
To learn more about the Grafana reporter module and how to make use of it, you can check the following blog post:
refer: https://github.com/kubernauts/jmeter-operator


Comments
Post a Comment