VSTS Performance Testing Tool
Create
a web performance and load test project
You
first create web performance tests. These tests are used in your load tests to
simulate multiple users
performing actions in your app at the same time.
1.
If you don't have
Visual Studio Enterprise.
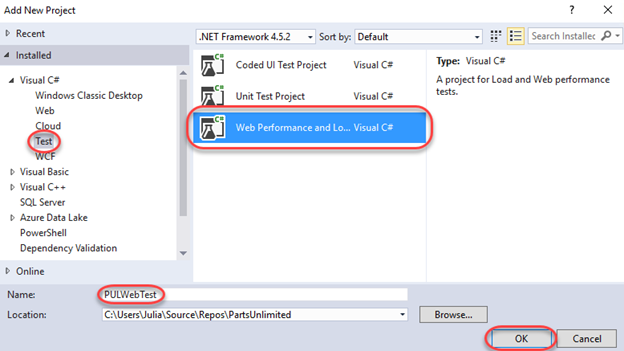
2.
Create a web
performance and load test project.

If you don't see the template for the web performance and
load test project type, ensure you have installed the required packages during
Visual Studio setup.

Record a web
performance test
1.
Create a web
performance test.

2.Your
web browser opens. Enter the URL for the website that you want to test.

3.Use
your application like you expect your customers to use it. For example, search for items
and add them to the shopping cart. The recorder will capture the HTTP requests
and responses.
4.
When you're done,
stop recording.

Now,
Visual Studio looks for dynamic parameters for the HTTP responses to each of your
HTTP requests. A progress bar appears
while this happens. If dynamic parameters
are found,
a table appears. You can assign constant values to each dynamic parameter.
5.Rename your test. For example,
ShoppingCart.webtest.

6.Edit
test properties to specify performance goals. For example, you can set a page response time goal of one second.

7.Save
the test.
Create a load test
1.
Create a new load
test in the web performance and load test project.

2.When
the load test wizard appears, choose the kind of load test that you'd like to run.

3.Change
the load pattern to step load. This gradually adds users over time.

4.Choose
the test mix step.

5.Add
the web performance test you created.

6.Move
the web performance test to the list of tests to run.

7.When
you run cloud-based load tests using your VSTS account, you can run those tests and
generate load in an Azure datacenter that's closer to your users. That way, you reduce latency
and simulate local conditions. Select the location where you want to run your load test.

8.After
you finish the wizard, the web performance test is added to the load test and appears in the load test editor.

Run and analyze your load test
You can run your load test locally,
or you can run it in the cloud using VSTS. All you need is a VSTS account. If you run the load
test in the cloud, you can generate more load without setting up test
controllers and test agents. To learn how easy it is to use Cloud-based Load
Testing to run your load tests.
Follow these steps to run your load
test on your local machine.
1.
Run the load test.

2.While
the test runs, you discover that the shopping cart page response time exceeds the value you set.

3.Add an
analysis note to track the issue.

4.After
the load test is finished, the summary is displayed.
The
results for the completed test include performance counter data, threshold violations, and error information.

5.Choose
the detail view. By analyzing the step load pattern for users, you can identify the user count where your performance fails to meet your
requirements.

6.Fix
any performance issues in your application's code and rerun the test.
<a
name="improvetests"
Improve
your load tests
You can improve your test to better
simulate real-world loads by specifying various load test scenario
properties and run settings
properties. For example, you can specify
the number of new users that will use web cache data in your load test.

Run a URL-based load test
1.
Sign in to your VSTS
account (https://your-account-name.visualstudio.com).
2.
Go to the Load
test hub, open the + New menu
and choose URL based test.

3.Type a
name for the load test, and enter the URL you want to test in the center column and in the details pane on
the right. For a simple load test, leave the HTTP method set to GET.

You can
add multiple URLs and select the method for each one, such as POST
or PUT.
You can also add headers and querystring values if you need to send these as
part of the
request. The URL Load Test accesses each of these URLs multiple times using the
parameters you specify, and
records the results.
4.Open
the Settings tab. Here you can change the parameters of the
test such as the duration, load pattern, number of users,
and more. To run the test near to your users,
select a Load location.
Then choose Save.

5.When
you have set up all the URLs and parameters for your test, start it by choosing
Run test.

6.As the
test runs, you see live information about the progress of the test. You can stop the
test by using the Abort link on the toolbar.

View the results
of the load test
1.
When your test is
done, look at the results to see how well your app performed. For example, you
can see an overview of your app's performance in the Summary tab.
This tab shows all of the main metrics such as average response time, user
load, requests per second, failed requests, any errors that might have
occurred, and test usage.

The
lower section of the Summary tab shows the settings used
for the test, and details of the five slowest requests during the test. If
there are any transaction tests, the tab will also show the five slowest of
these. Use the icon above a column to sort the list based on the contents of
that column.
2.Open
the Charts tab to see a graphical representation of the test
results over time. The charts show the average performance,
throughput, errors, and the results of
each test request. Hover your mouse
pointer over a chart to see more details.

3.Open
the Diagnostics tab to see detailed information such as a list
of errors and s tatus messages.

You can
also use the icon in the Errors section of the Summary
tab to go directly t o
the Diagnostics tab.

4.Open
the Logs tab to see a list of test runs. Choose the link in the
Attachment column
to download the detailed log as a
text file.

5.To run
the same test again, choose Rerun.

Open a load test in
Visual Studio
1.
Open your load test
project, open the Load test menu, and
choose Load Test Manager.

2.The Load
Test Manager page shows all of the
load test runs started by you and all of your team
members.

Open a load test in VSTS
•
If you are running
URL-based or Apache JMeter load tests, you can see the list of all the test
runs in Visual Studio Team Services Load test list.

Filter and select
a load test
1.Filter
the list of load tests by state, date, or user who created the test run.

2.Select
a test run and open the shortcut menu icon to see details of the test run, or stop a
running test.

Compare two test runs
1.
To compare two test
runs, select them in the list by holding CTRL while clicking with the mouse. Then choose the Compare
two runs icon on the toolbar, or open the shortcut menu for one
of the test runs and choose Compare.

2.In the
comparison page you see the names of the two tests and, at the top of the page, Summary section
that lists the prime performance factors for each test, then the difference from
the baseline as a percentage (the color of this text indicates a gain or loss in performance).

Use the
links in the first row, the names and IDs of the test runs, to open the detailed view of that test run.
3.The Charts
section of the page shows a graphical
comparison of performance for the two test runs. The default is a chart for the
response time and user load. Choose a different pair of factors from the dropdown menu to see more performance
comparisons.

4.The Test
settings section lists the primary
settings specified for the two test runs. Again,
the names and IDs of the tests are hyperlinks that open the details of that test.


Comments
Post a Comment